
RI_593
Type of resources
Topics
Keywords
Contact for the resource
Provided by
Years
Formats
Representation types
Update frequencies
status
-
Attribute data table which contains survey effort values for each season, total bird density, species richness value, species at risk score, and grid cell importance score.
-
The data consists of temperature indices based on homogenized daily maximum and minimum temperatures at 338 locations across Canada, and of precipitation indices based on adjusted daily rainfall, daily snowfall and daily precipitation amounts at 463 locations across the country. These indices were selected for their relevance to social and economic impact assessment in Canada and for the insights they could provide regarding changes in extreme climate conditions. Please refer to the papers below for detailed information regarding the adjustment procedures and the trends in the indices.
-
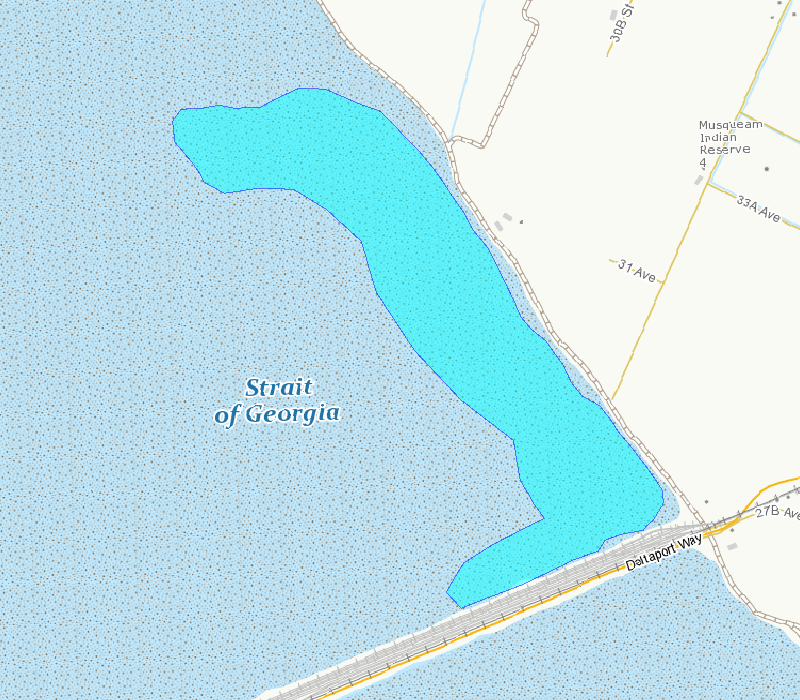
This polygon outlines the basic area included in the survey counts. This area is the best approximation of the mudflat that can be surveyed from shore and is exposed at tide tide height of 3.5 m, based on tidal predictions at Point Atkinson, British Columbia.
-
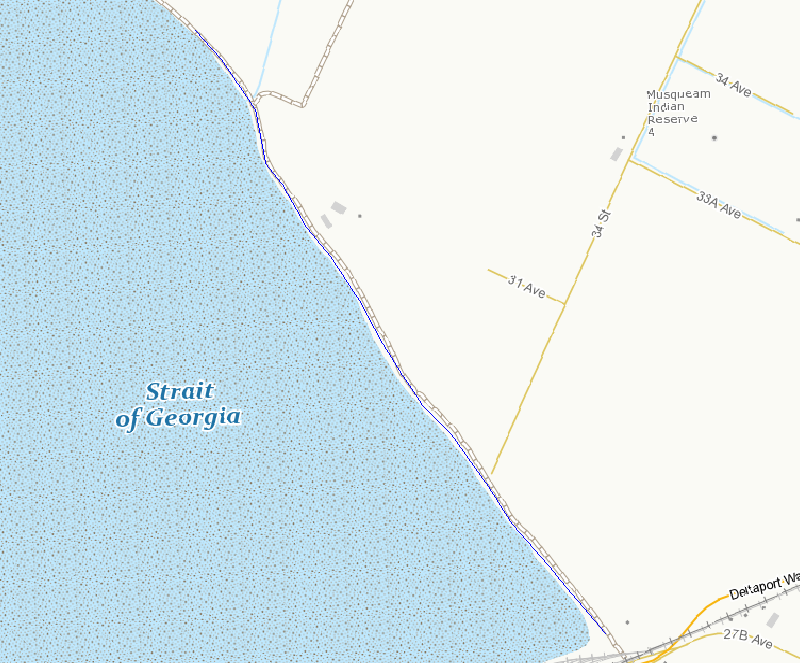
This line outlines the basic survey route included in the survey counts. This route is the best access to areas that can be surveyed from shore.
-
Sidney Island Shorebirds Survey peep counts.
-
The rationale for developing this product was the recognized need for a standard and adaptable marine grid that could be used for planning or analysis purposes across projects. This nested grid has five spatial resolutions: 8km, 4km, 2km, 1km, and 500m. It covers the extent of the EEZ on the Canadian Pacific coast, and further east in order to encompass the Fraser River Delta and Puget Sound to account for ecological importance. There is a step-by-step methods document that gives users information on how to recreate the grid with ArcMap.
-
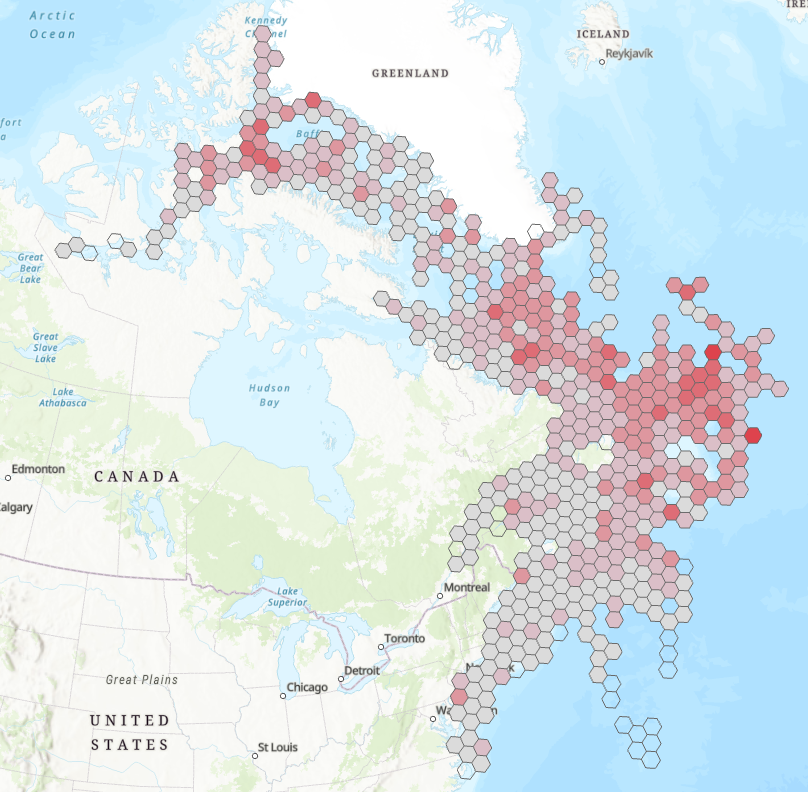
The atlas provides printable maps, Web Services and downloadable data files representing seabirds at-sea densities in eastern Canada. The information provided on the open data web site can be used to identify areas where seabirds at sea are found in eastern Canada. However, low survey effort or high variation in some areas introduces uncertainty in the density estimates provided. The data and maps found on the open data web site should therefore be interpreted with an understanding of this uncertainty. Data were collected using ships of opportunity surveys and therefore spatial and seasonal coverage varies considerably. Densities are computed using distance sampling to adjust for variation in detection rates among observers and survey conditions. Depending on conditions, seabirds can be difficult to identify to species level. Therefore, densities at higher taxonomic levels are provided. more details in the document: Atlas_SeabirdsAtSea-OiseauxMarinsEnMer.pdf. By clicking on "View on Map" you will visualize a example of the density measured for all species combined from April to July - 2006-2020. ESRI REST or WMS map services can be added to your web maps or opened directly in your desktop mapping applications. These are alternatives to downloading and provide densities for all taxonomical groups and species as well as survey effort.
-
The Atlas of Pelagic Seabirds off the West Coast of Canada presents maps that display the distribution of 48 species of seabirds and two species pairs (i.e., Red-necked and Red Phalaropes, and Hawaiian and Galapagos Petrels). Seabird surveys were conducted aboard commercial and Canadian federal government ‘ships-of-opportunity’ from 1982-1983 and 1991-2005 within the study area (45° N to 58° N and from the coast to 148° W). Sightings of rare species that came from other sources (including some pre 1982 and post 2005) are also included in order to present as complete a picture as possible. For 33 species and one species pair, the average densities within 5’ latitude by 5’ longitude grid cells are displayed seasonally. The seabirds mapped in this manner include 11 species of Procellariiformes (albatrosses, fulmars, petrels, shearwaters and storm-petrels), and 24 species of Charadriiformes (phalaropes, skuas, gulls, terns and auks). The sighting locations for an additional 15 species and one species pair are also mapped. This group, comprised of 10 species of Procellariiformes and seven species of Charadriiformes includes species that are relatively uncommon to rare in the study area (but previously documented); and species that are extremely rare and/or have not been documented and thus remain unconfirmed. These data may be used to generate presence/absence and trends in and estimates of relative abundance. These data can also be used to examine patterns in temporal and spatial distribution. However, due to the opportunistic nature of the surveys, both in space and time, these data should not be used to determine absolute abundance. The rationale for developing this atlas was the recognized need for a product that could assist with: coastal zone and conservation area planning; emergency response to environmental emergencies; and identification of areas of potential interactions between seabirds and anthropogenic activities. In addition, the data used to develop the document provides a baseline to compare with future seabird distributions in order to measure the impacts of shifts in composition, abundance and/or distribution of prey, and climatic and oceanographic changes.
-
This dataset contains blended (gauge and satellite estimates) pentad mean precipitation rates (unit: mm/day) at a one degree spatial resolution over Canada. The data can be used for hydrometeorological, agricultural, forestry modelling, for numerical weather model and climate model verification, and for climate impact studies.
-
The dataset contains the blended (gauge and satellite estimates) monthly mean precipitation rates (unit: mm/day) for Canada for the period from January 1979 to December 2007, at a half degree spatial resolution. Please refer to the paper below for the details of the blending algorithm and input gauge and satellite data. Reference: Lin, A. and X. L. Wang, 2011: An algorithm for Blending Multiple Satellite Precipitation Estimates with in-situ Precipitation Measurements in Canada. JGR-Atmospheres, 116, D21111, doi:10.1029/2011JD016359.