
RI_636
Type of resources
Topics
Keywords
Contact for the resource
Provided by
Years
Formats
Representation types
Update frequencies
status
-
The rationale for developing this product was the recognized need for a standard and adaptable marine grid that could be used for planning or analysis purposes across projects. This nested grid has five spatial resolutions: 8km, 4km, 2km, 1km, and 500m. It covers the extent of the EEZ on the Canadian Pacific coast, and further east in order to encompass the Fraser River Delta and Puget Sound to account for ecological importance. There is a step-by-step methods document that gives users information on how to recreate the grid with ArcMap.
-
The Regional Air Quality Deterministic Prediction System FireWork (RAQDPS-FW) carries out physics and chemistry calculations, including emissions from active wildfires, to arrive at deterministic predictions of chemical species concentration of interest to air quality, such as fine particulate matter PM2.5 (2.5 micrometers in diameter or less). Geographical coverage is Canada and the United States. Data is available at a horizontal resolution of 10 km. While the system encompasses more than 80 vertical levels, data is available only for the surface level. The products are presented as historical, annual or monthly, averages which highlight long-term trends in cumulative effects on the environment.
-

This map shows the projected average change in mean temperature (°C) for 2016-2035, with respect to the reference period of 1986-2005 for RCP4.5. The median projected change across the ensemble of CMIP5 climate models is shown. For more maps on projected change, please visit the Canadian Climate Data and Scenarios (CCDS) site: http://ccds-dscc.ec.gc.ca/index.php?page=download-cmip5.
-

This map shows the projected average change in mean temperature (°C) for 2046-2065, with respect to the reference period of 1986-2005 for RCP4.5. The median projected change across the ensemble of CMIP5 climate models is shown. For more maps on projected change, please visit the Canadian Climate Data and Scenarios (CCDS) site: http://ccds-dscc.ec.gc.ca/index.php?page=download-cmip5.
-

This map shows the projected change in mean precipitation for 2081-2100, with respect to the reference period of 1986-2005 for RCP8.5, expressed as a percentage (%) of mean precipitation in the reference period. The median projected change across the ensemble of CMIP5 climate models is shown. For more maps on projected change, please visit the Canadian Climate Data and Scenarios (CCDS) site: http://ccds-dscc.ec.gc.ca/index.php?page=download-cmip5.
-
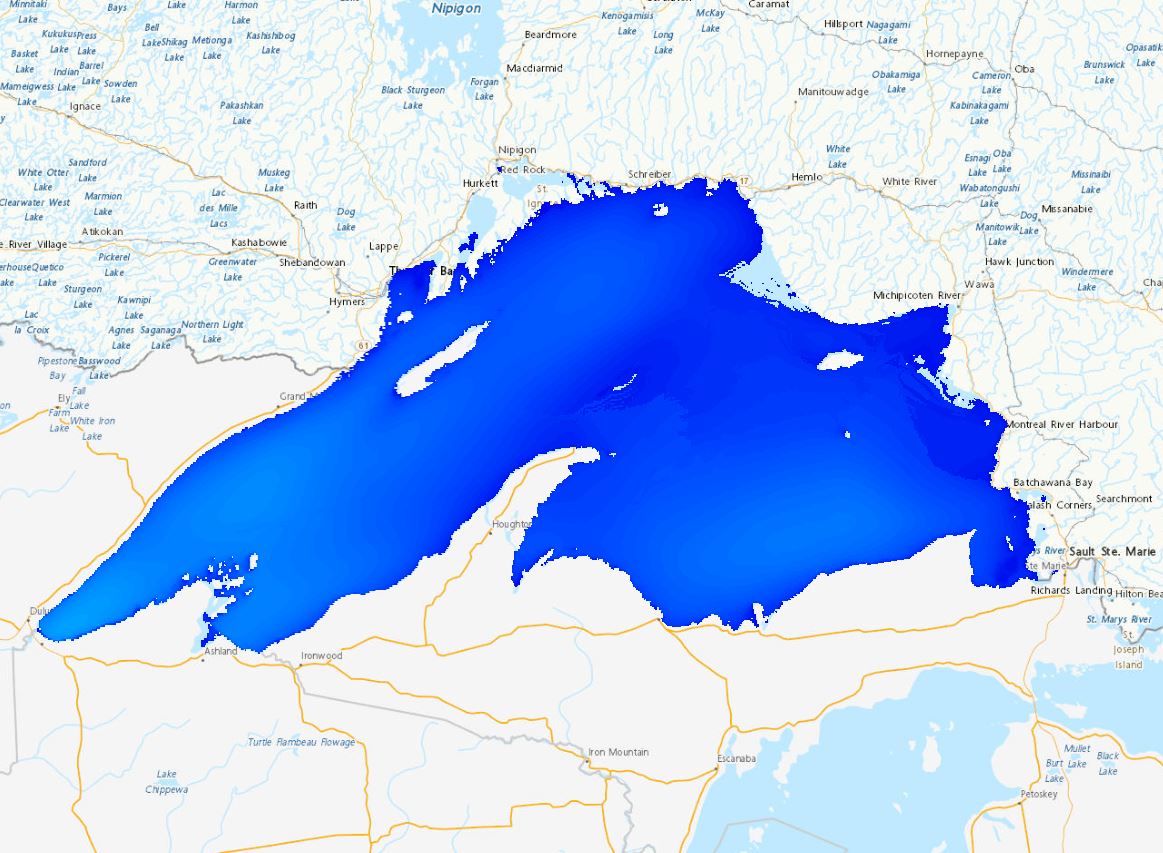
The Regional Deterministic Wave Prediction System (RDWPS) produces wave forecasts out to 48 hours in the future using the third generation spectral wave forecast model WaveWatch III® (WW3). The model is forced by the 10 meters winds from the High Resolution Deterministic Prediction System (HRDPS). Over the Great Lakes, an ice forecast from the Water Cycle Prediction System of the Great Lakes (WCPS) is used by the model to attenuate or suppress wave growth in areas covered by 25% to 75% and more than 75% ice, respectively. Over the ocean, an ice forecast from the Regional Ice Ocean Prediction System (RIOPS) is used: in the Northeast Pacific, waves propagate freely for ice concentrations below 50%, above this threshold there is no propagation; in the Northwest Atlantic the same logic is used as in the Great Lakes. Forecast elements include significant wave height, peak period, partitioned parameters and others. This system includes several domains: Lake Superior, Lake Huron-Michigan, Lake Erie, Lake Ontario, Atlantic North-West and Pacific North-East.
-
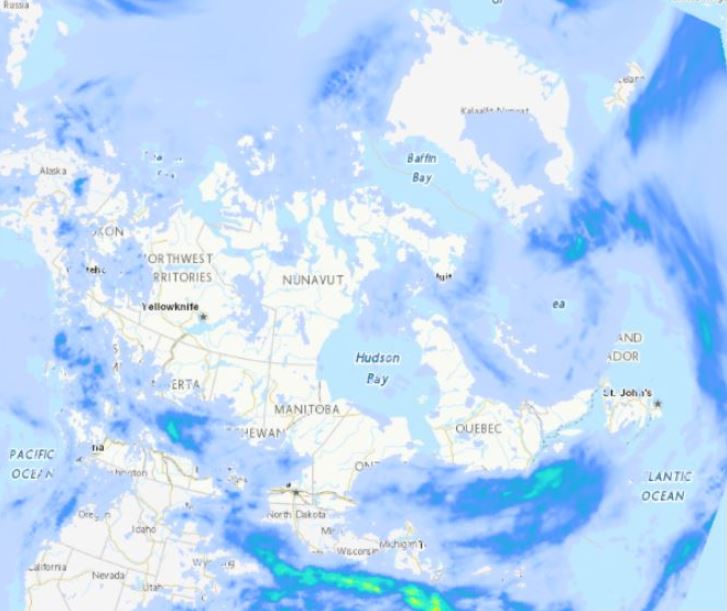
The Regional Deterministic Precipitation Analysis (RDPA) produces a best estimate of precipitation amounts that occurred over a period of 24 hours. The estimate integrates data from in situ precipitation gauge measurements, weather radar, satellite imagery and numerical weather prediction models. Geographic coverage is North America (Canada, United States and Mexico). Data is available at a horizontal resolution of 10 km. The 24 hour analysis is produced twice a day and is valid at 06 and 12 UTC. A preliminary analysis is available approximately 1 hour after the end of the accumulation period and a final one is generated 7 hours later in order to assimilate more gauge data.
-
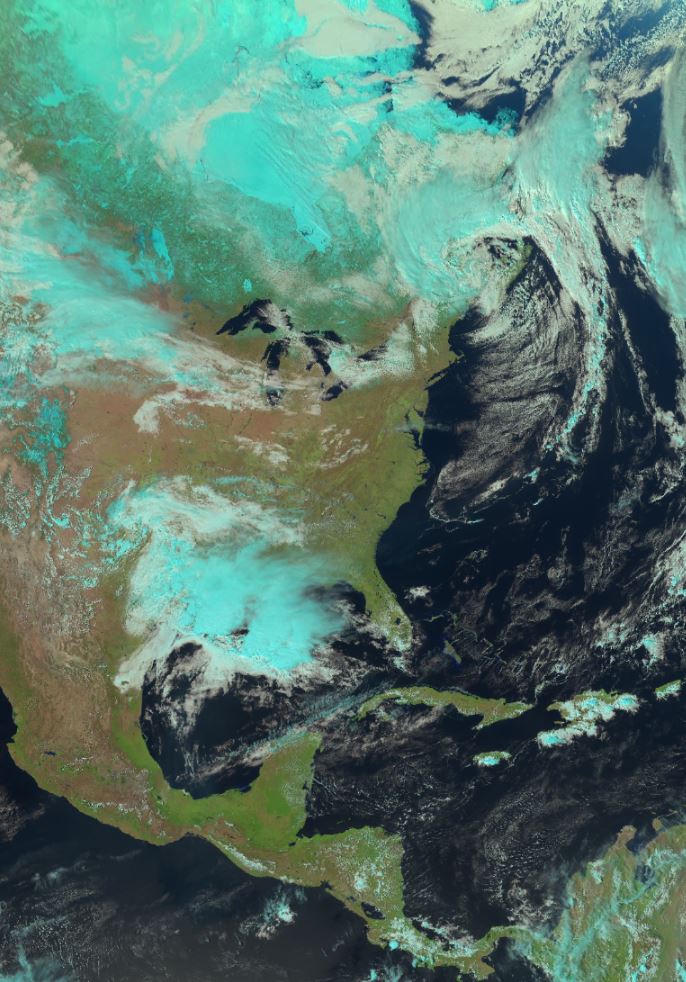
These products are derived from RGB (red/green/blue) images, a satellite processing technique that uses a combination of satellite sensor bands (also called channels) and applies a red/green/blue (RGB) filter to each of them. The result is a false-color image, i.e. an image that does not correspond to what the human eye would see, but offers high contrast between different cloud types and surface features. The on-board sensor of a weather satellite obtains two basic types of information: visible light data (reflected light) reflecting off clouds and different surface types, also known as "reflectance", and infrared data (emitted radiation) which are long-wave radiations emitted by clouds and surface features. RGBs are specially designed to combine this type of satellite data, resulting in an information-rich final product. Four types of products are currently generated from the GOES-West and GOES-East satellites: "NightIR" and "NightMicrophysics", at 2km resolution, are generated 24 hours a day with infrared channels, so are visible both night and day, and "NaturalColour" and "DayCloudConvection", at 1km resolution, which combine visible light channels with infrared channels; their higher resolution makes the latter two products more popular, but they are not available during most of the night (between 02UTC and 07UTC for GOES-Est, and between 06UTC and 11UTC for GOES-Ouest) given the absence of reflected sunlight. Other RGB products should be added gradually in the future to meet different needs.
-

This map shows the projected change in mean precipitation for 2016-2035, with respect to the reference period of 1986-2005 for RCP8.5, expressed as a percentage (%) of mean precipitation in the reference period. The median projected change across the ensemble of CMIP5 climate models is shown. For more maps on projected change, please visit the Canadian Climate Data and Scenarios (CCDS) site: http://ccds-dscc.ec.gc.ca/index.php?page=download-cmip5.
-

This map shows the projected average change in mean temperature (°C) for 2081-2100, with respect to the reference period of 1986-2005 for RCP8.5. The median projected change across the ensemble of CMIP5 climate models is shown. For more maps on projected change, please visit the Canadian Climate Data and Scenarios (CCDS) site: http://ccds-dscc.ec.gc.ca/index.php?page=download-cmip5.