
2023
Type of resources
Topics
Keywords
Contact for the resource
Provided by
Years
Formats
Representation types
Update frequencies
status
-

The Canadian Environmental Sustainability Indicators (CESI) program provides data and information to track Canada's performance on key environmental sustainability issues. The Releases of harmful substances to water indicator tracks facility-based releases to water of 3 substances that are defined as toxic under the Canadian Environmental Protection Act, 1999: mercury, lead and cadmium and their compounds. For each substance, data are provided at the national, regional (provincial and territorial) and facility level and by source. Mercury and its compounds, lead and inorganic cadmium compounds are on the Toxic substances list under Schedule 1 of the Canadian Environmental Protection Act, 1999. This means that these substances are "entering or may enter the environment in a quantity or concentration or under conditions that (a) have or may have an immediate or long-term harmful effect on the environment or its biological diversity; (b) constitute or may constitute a danger to the environment on which life depends; or (c) constitute or may constitute a danger in Canada to human life or health." The indicators inform Canadians about releases to water of these 3 substances from facilities in Canada. The Releases of harmful substances to water indicators also help the government to identify priorities and develop or revise strategies to inform further risk management and to track progress on policies put in place to reduce or control these 3 substances and water pollution in general. Information is provided to Canadians in a number of formats including: static and interactive maps, charts and graphs, HTML and CSV data tables and downloadable reports. See the supplementary documentation for the data sources and details on how the data were collected and how the indicator was calculated. Canadian Environmental Sustainability Indicators: https://www.canada.ca/environmental-indicators
-
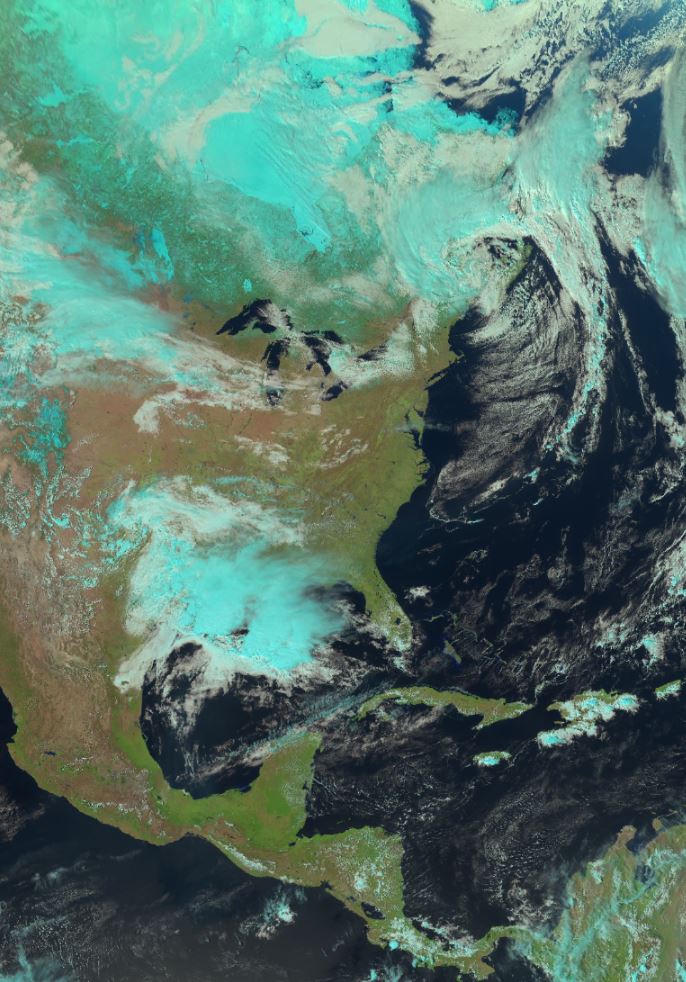
These products are derived from RGB (red/green/blue) images, a satellite processing technique that uses a combination of satellite sensor bands (also called channels) and applies a red/green/blue (RGB) filter to each of them. The result is a false-color image, i.e. an image that does not correspond to what the human eye would see, but offers high contrast between different cloud types and surface features. The on-board sensor of a weather satellite obtains two basic types of information: visible light data (reflected light) reflecting off clouds and different surface types, also known as "reflectance", and infrared data (emitted radiation) which are long-wave radiations emitted by clouds and surface features. RGBs are specially designed to combine this type of satellite data, resulting in an information-rich final product. Four types of products are currently generated from the GOES-West and GOES-East satellites: "NightIR" and "NightMicrophysics", at 2km resolution, are generated 24 hours a day with infrared channels, so are visible both night and day, and "NaturalColour" and "DayCloudConvection", at 1km resolution, which combine visible light channels with infrared channels; their higher resolution makes the latter two products more popular, but they are not available during most of the night (between 02UTC and 07UTC for GOES-Est, and between 06UTC and 11UTC for GOES-Ouest) given the absence of reflected sunlight. Other RGB products should be added gradually in the future to meet different needs.
-
The Canadian Environmental Sustainability Indicators (CESI) program provides data and information to track Canada's performance on key environmental sustainability issues. The Population exposure to outdoor air pollutants indicator tracks the proportion of the Canadian population living in areas where outdoor concentrations of air pollutants are below the 2020 Canadian Air Ambient Quality Standards. Canadians are exposed to air pollutants on a daily basis, and this exposure can result in adverse health and environmental effects. Exposure to some air pollutants, even at low levels, has been linked to increased heart and respiratory problems, increased hospitalization and emergency room visits and premature death. Information is provided to Canadians in a number of formats including: static and interactive maps, charts and graphs, HTML and CSV data tables and downloadable reports. See the supplementary documentation for the data sources and details on how the data were collected and how the indicator was calculated. Canadian Environmental Sustainability Indicators: https://www.canada.ca/environmental-indicators
-
The Canadian Environmental Sustainability Indicators (CESI) program provides data and information to track Canada's performance on key environmental sustainability issues. The Sea ice in Canada indicators provide information on the area of sea in Canada covered by ice during the summer season. Sea ice area represents the portion of marine area covered by ice. The area is evaluated using the Canadian Ice Service Digital Archive and is expressed in thousands or millions of square kilometres. The Sea ice in Canada indicators are provided for the Northern Canadian Waters, by sub-region and for the Northwest Passage. The indicators also present trends in total sea ice area and multi-year sea ice area. Multi-year sea ice is defined as sea ice that has survived at least one summer's melt. Sea ice is an indicator of how the climate is changing. It is a critical component of our planet because it influences the Arctic and global climate, ecosystems, and people who live in the polar regions. Sea ice influences the climate through the sea ice–albedo feedback effect (or reflectivity of the Earth's surface). Changes in sea ice can also affect ocean currents and the exchange of heat and water vapour from the ocean to the atmosphere. Sea ice affects marine transportation, commercial fishing, offshore resource development, the hunting and fishing patterns of Indigenous peoples, and tourism and recreation. Understanding how Canada's climate is changing is important for developing adaptive responses. The Sea ice in Canada indicators provide a way to communicate to Canadians how the coverage of Canada's Arctic sea ice has changed. The Intergovernmental Panel on Climate Change and the World Meteorological Organization use sea ice, among several other variables, to assess long-term changes in climate. Sea ice is considered by the World Meteorological Organization's Global Climate Observing System to be an Essential Climate Variable. Information is provided to Canadians in a number of formats including: static and interactive maps, charts and graphs, HTML and CSV data tables and downloadable reports. See the supplementary documentation for the data sources and details on how the data were collected and how the indicator was calculated. Canadian Environmental Sustainability Indicators: https://www.canada.ca/environmental-indicators
-
The Canadian Environmental Sustainability Indicators (CESI) program provides data and information to track Canada's performance on key environmental sustainability issues. If unsafe bacterial levels are measured in water samples or if shoreline surveys identify pollution concerns, Environment and Climate Change Canada makes water classification recommendations to its Canadian Shellfish Sanitation Program partners. Fisheries and Oceans Canada opens or closes shellfish harvest areas based on those recommendations. While elements of program operations and implementation have some impact on the results, the indicators track the proportion of shellfish harvest areas that have their water quality classified as approved or conditionally approved and the proportion of samples with fecal coliform levels less than 43 most probable number (MPN) per 100 mL as a coarse measure of the quality of marine coastal water. Information is provided to Canadians in a number of formats including: static and interactive maps, charts and graphs, HTML and CSV data tables and downloadable reports. See the supplementary documentation for the data sources and details on how the data were collected and how the indicator was calculated. Canadian Environmental Sustainability Indicators: https://www.canada.ca/environmental-indicators
-
The Canadian Environmental Sustainability Indicators (CESI) program provides data and information to track Canada's performance on key environmental sustainability issues. The Global greenhouse gas emissions indicator reports global human emissions of GHGs for 2005 and 2020, both in total and per capita. The indicator provides a global perspective on Canada's share of GHG emissions. Information is provided to Canadians in a number of formats including: static and interactive maps, charts and graphs, HTML and CSV data tables and downloadable reports. See the supplementary documentation for the data sources and details on how the data were collected and how the indicator was calculated. Canadian Environmental Sustainability Indicators: https://www.canada.ca/environmental-indicators
-
Annual and five-year (5YA) average wet deposition maps for the non-sea-salt sulfate ion are available. The file formats include geodatabase files (*.gdb) compatible with geospatial software (e.g. ESRI ArcGIS) and KMZ files compatible with virtual globe software (e.g. Google Earth™). Maps can also be viewed online via Open Maps and the ArcGIS online viewer. Annual deposition from each site was screened for completeness using the following criteria: (1) precipitation amounts were recorded for >90% of the year and >60% of each quarter, and (2) sulfate concentrations were reported for >70% of the precipitation measured over the year and for >60% of each quarter. Five-year average wet deposition values are averaged annual deposition values with a completeness criterion >60% for the five-year period. Units for wet deposition fluxes are in kg of xSO4 per hectare per year (kg ha-1 y-1). Sources of measurement data and spatial interpolation method are described here: https://doi.org/10.18164/e8896575-1fb8-4e53-8acd-8579c3c055c2. Recommended citation: Environment and Climate Change Canada, [year published]. xSO4 Wet Deposition Maps. Air Quality Research Division, Environment and Climate Change Canada, Toronto, Ontario, Canada. [URL/DOI], accessed [date]. Recommended acknowledgement: The author(s) acknowledge Environment and Climate Change Canada for the provision of Canada-U.S. wet deposition kriging maps accessed from the Government of Canada Open Government Portal at open.canada.ca, and the data providers referenced therein.
-
We studied the community structure of crustacean zooplankton along the biogeographical zones of the St. Lawrence River (Québec, Canada), to evaluate how the riverscale hydrological network formed by water masses, and local-scale aquatic environment, influenced the distribution of zooplankton during the spring (high discharge) and summer (low discharge) hydroperiods. R code for all data analysis will be available in R format via GitHub. A direct URL will be provided once this has been uploaded. All data are a part subject of a publication containing method details, full QA/QC, interpretation and conclusions. Citation: Taranu, Z.E., Legendre, P., Cusson, E. et al. Riverscale distribution of zooplankton in the St. Lawrence River in relation to hydrological networks, hydroperiods and local environmental gradients. Hydrobiologia (2023). doi.org/10.1007/s10750-023-05259-7
-
The Canadian Environmental Sustainability Indicators (CESI) program provides data and information to track Canada's performance on key environmental sustainability issues. The Global Trends in Conserved Areas indicator reports the amount and percentage of global terrestrial and marine area conserved for the preservation of nature. The indicator also shows a comparison of area protected among 10 selected countries. Global information on protected areas and other effective area-based conservation measures is collected, analyzed and made available by the World Database on Protected Areas and the World Database on Other Effective Area-based Conservation Measures. Land and/or water access and use within protected areas are controlled primarily for the purpose of conserving nature (for example, a park, a conservation area or a wildlife reserve). Other effective area-based conservation measures (OECMs) are also managed in ways that achieve positive and sustained long-term outcomes for the conservation of biodiversity, regardless of their stated objectives. Conserved areas (protected areas and OECMs) are key management tools used for the preservation of biodiversity. Well-managed conserved areas are one way to protect wild species and their habitats for present and future generations. Habitat conservation is a measure of human response to the loss of biodiversity and natural habitat. Information is provided to Canadians in a number of formats including: static and interactive maps, charts and graphs, HTML and CSV data tables and downloadable reports. See the supplementary documentation for the data sources and details on how the data were collected and how the indicator was calculated. Canadian Environmental Sustainability Indicators: https://www.canada.ca/environmental-indicators
-
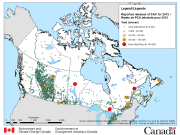
The National Pollutant Release Inventory (NPRI) is Canada's public inventory of pollutant releases (to air, water and land), disposals and transfers for recycling. The files below contain a map of Canada showing the locations of all facilities that reported direct releases of Criteria Air Contaminants to the NPRI. The data are for the most recent reporting year, by reported total quantities of these releases. The map is available in both ESRI REST (to use with ARC GIS) and WMS (open source) formats. For more information about the individual reporting facilities, a dataset is available in a CSV format. Please consult the following resources to enhance your analysis: - Guide on using and Interpreting NPRI Data: https://www.canada.ca/en/environment-climate-change/services/national-pollutant-release-inventory/using-interpreting-data.html - Access additional data from the NPRI, including datasets and mapping products: https://www.canada.ca/en/environment-climate-change/services/national-pollutant-release-inventory/tools-resources-data/exploredata.html