
climatologyMeteorologyAtmosphere
Type of resources
Topics
Keywords
Contact for the resource
Provided by
Years
Formats
Representation types
Update frequencies
status
-
The data consists of temperature indices based on homogenized daily maximum and minimum temperatures at 338 locations across Canada, and of precipitation indices based on adjusted daily rainfall, daily snowfall and daily precipitation amounts at 463 locations across the country. These indices were selected for their relevance to social and economic impact assessment in Canada and for the insights they could provide regarding changes in extreme climate conditions. Please refer to the papers below for detailed information regarding the adjustment procedures and the trends in the indices.
-
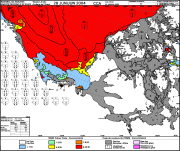
This daily forecast describes the ice edge using latitude and longitude coordinates, the total ice concentration, the predominant ice stage of development and the concentration of the oldest ice type. Warnings are issued as appropriate. The forecasts are valid from the time of issue until the end of the following day (so for a period of 24 to 48 hours).
-
The Canadian Ice Service maintains a collection of Daily ice charts, Regional ice charts and Iceberg charts. These charts are available in GIF format and E00 (Regional Charts only).
-
Ambient air is sampled daily, with a nominal 24-hour sampling period, on a Canadian Air and Precipitation Monitoring Network (CAPMoN) sequential sample head located 10 meters above ground. Air is drawn through a three-stage filter pack consisting of 47-millimeter Teflon, nylon and cellulose filters. Particulate Cl-, NO3-, SO4=, NH4+, Na+, K+, Ca++ and Mg++ are collected on the Teflon filter, gaseous HNO3 and a small amount of SO2 are collected by the nylon filter, and gaseous SO2 and residual HNO3 are collected by the K2CO3-impregnated cellulose filter. Filter loadings determined by laboratory extraction and analysis are blank corrected and divided by calibrated sample air volume to get atmospheric concentration in micrograms per cubic meter at International Union of Pure and Applied Chemistry (IUPAC) standard temperature and pressure. The sampling and analysis methodology is described in Sirois and Fricke, 1992.
-
In 2015 as part of the Canadian Artic Weather Science (CAWS) project, Environment and Climate Change Canada (ECCC) established an enhanced monitoring reference site at Iqaluit, Nunavut (CYFB, 63°45N, 68°33W) in the eastern Canadian Arctic. The site was strategically selected at the loci of synoptic storm tracks and primary transportation corridors. CYFB is also a major aviation hub for the North. It is an operational upper air site with an existing office building and instrument test facility infrastructure with a co-located Double Fence International Reference for solid precipitation measurements. The site was to provide automated and continuous observations of altitude-resolved winds, clouds and aerosols, visibility, radiation fluxes, turbulence, and precipitation. The benefit of integrated measurement systems at the Iqaluit supersite are being investigated to: 1) Recommend the optimal cost-effective observing system for the Canadian Arctic that can complement existing radiosonde observations 2) Provide enhanced meteorological observations during the World Meteorological Organization’s Year of Polar Prediction (WMO YOPP). Instrumentation at Iqaluit includes a Ka-band radar, water vapour lidars (both in-house and commercial versions), multiple Doppler lidars, ceilometers, radiation flux and precipitation sensors, and others. Data collection for a subset of the instruments at Iqaluit began in March 2016.
-
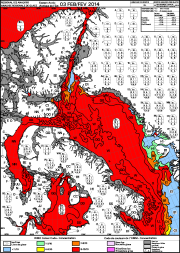
These ice charts illustrate ice conditions at a particular moment in time. The ice information is presented using a standard international code, known as the Egg Code. The following charts are available from the Canadian Ice Service: -Daily Ice Charts -Image Analysis Ice Charts -Regional Ice Charts
-
The Homogenized Surface Pressure data consist of monthly, seasonal and annual means of hourly sea level and station pressure (hectopascals) for 626 locations in Canada. Homogenized climate data incorporate adjustments (derived from statistical procedures) to the original station data to account for discontinuities from non-climatic factors, such as instrument changes or station relocation. The time periods of the data vary by location, with the oldest data available from 1953 at some stations to the most recent update in 2014. Data availability over most of the Canadian Arctic is restricted to 1953 to present. The data will continue to be updated every few years (as time permits).
-
Precipitation measurements in the Environment and Climate Change Canada (ECCC) surface network are a necessary component for monitoring weather and climate and are required for flood and water resource forecasting, numerical weather prediction and many other applications that impact the health and safety of Canadians. Beginning in the late 1990s, the ECCC surface network began a transition from manual to automated precipitation measurements. Advantages to increased automation include enhanced capabilities for monitoring in remote locations and higher observation frequency at lower cost. However, transition to automated precipitation gauges has resulted in new challenges to data quality, accuracy, and homogenization. Automated weighing precipitation gauges used in the ECCC operational network, because of their physical profile, tend to measure less precipitation falling as snow because lighter particles (snow) are deflected away from the collector by the wind flow around the gauge orifice. This phenomenon of wind-induced systematic bias is well documented in the literature. The observation requires an adjustment depending on gauge and shield configuration, precipitation phase, temperature, and wind speed. Hourly precipitation, wind speed, and temperature for 397 ECCC automated surface weather stations were retrieved from the ECCC national archive. Climate Research Division (CRD) selected this sub-set of stations because they are critical to the continuity of various climate analysis. The observation period varies by station with the earliest data series beginning in 2001 (with most beginning in 2004). The precipitation data was quality controlled using established techniques to identify and flag outliers, remove spurious observations, and correct for previously identified filtering errors. The resulting hourly precipitation data was adjusted for wind bias using the WMO Solid Precipitation Inter-Comparison Experiment (SPICE) Universal Transfer Function (UTF) equation. A full description of this data set, including the station locations, data format, methodology, and references are included in the repository.
-
This dataset contains blended (gauge and satellite estimates) pentad mean precipitation rates (unit: mm/day) at a one degree spatial resolution over Canada. The data can be used for hydrometeorological, agricultural, forestry modelling, for numerical weather model and climate model verification, and for climate impact studies.
-
This daily forecast describes the ice edge using latitude and longitude coordinates, the total ice concentration, the predominant ice stage of development and the concentration of the oldest ice type. Warnings are issued as appropriate. The forecasts are valid from the time of issue until the end of the following day (so for a period of 24 to 48 hours).