
Biota
Type of resources
Topics
Keywords
Contact for the resource
Provided by
Years
Formats
Representation types
Update frequencies
status
-
This collection houses PDFs of active BBS route maps, which are grouped by province or territory. These maps allow BBS volunteers in Canada to easily locate the start of their route, and to navigate the official route. The BBS is jointly coordinated by Environment Canada's Canadian Wildlife Service and the U.S. Geological Survey (USGS), Patuxent Wildlife Research Center. Any use of BBS data for Canada should acknowledge the hundreds of skilled volunteers in Canada who have participated in the BBS over the years, those who have served as provincial or territorial coordinators for the BBS, and the Boreal Avian Modelling Project (BAM; www.borealbirds.ca), whose collaboration was invaluable to the creation of the BBS route and stop location dataset.
-
The North American Breeding Bird Survey (BBS) is a road-based, long-term, continental survey that focuses on measuring breeding bird abundance at 50 stops along roughly 40-km long transects. This collection houses PDFs of active BBS route maps, which are grouped by province or territory. These maps allow BBS volunteers in Canada to easily locate the start of their route, and to navigate the official route. Once available, the collection will also house the GIS shapefiles for all active and discontinued route paths in Canada, and the current locations for all 50 stops along each transect. This collection also houses archived trend results and annual indices derived from analyses prepared by the Canadian Wildlife Service using BBS data for 2009, 2011 and 2012. A link for the most current BBS trend results is provided below under Supplemental Information. Raw BBS data are publicly available through through the USGS Patuxent Wildlife Research Center's website, at the link provided below under Supplemental Information. The BBS is jointly coordinated by Environment Canada's Canadian Wildlife Service and the U.S. Geological Survey (USGS), Patuxent Wildlife Research Center. Any use of BBS data for Canada should acknowledge the hundreds of skilled volunteers in Canada who have participated in the BBS over the years, those who have served as provincial or territorial coordinators for the BBS, and the Boreal Avian Modelling Project (BAM; www.borealbirds.ca), whose collaboration was invaluable to the creation of the BBS route and stop location dataset.
-
The Canadian Breeding Bird Census (BBC) Database contains data for 928 breeding bird plot censuses representing all known censuses of breeding birds carried out in Canada during the period 1929–1993. The 928 records in the database represent 640 unique census plots located in all provinces and territories, except Prince Edward Island. The BBC, which was replaced by the current Breeding Bird Survey, is one of the longest-running surveys of bird populations in North America, and was designed to help determine abundance and distribution patterns of bird species. An important feature of the BBC Database is the habitat data associated with each census plot. The most prevalent vegetation species in different layers (canopy, shrub and ground cover) were recorded to reflect the assumption that birds respond principally to vegetative structure.
-
The Stanley Park Winter Waterbird Survey, 1995-2019, was made possible through a co-operative effort between Environment and Climate Change Canada, the British Columbia Institute of Technology’s Wildlife and Recreation Program, and the Stanley Park Ecology Society. The intent of the survey is to collect data to estimate the presence, abundance, and distribution of waterbirds along the Stanley Park foreshore in Vancouver, British Columbia, Canada. This dataset is a compilation of species-level occurrence, abundance and distribution data of marine birds collected systematically for the last 23 years (1995-2019) on roughly a weekly basis between September and April each year along the Stanley Park seawall. This long-term dataset of marine birds, has a high value for analysing spatiotemporal trends in marine bird species.
-
Survey points is a point feature class containing transects and observations completed in 2011.
-
Surveyor shorebird bird observations and counts for all years.
-
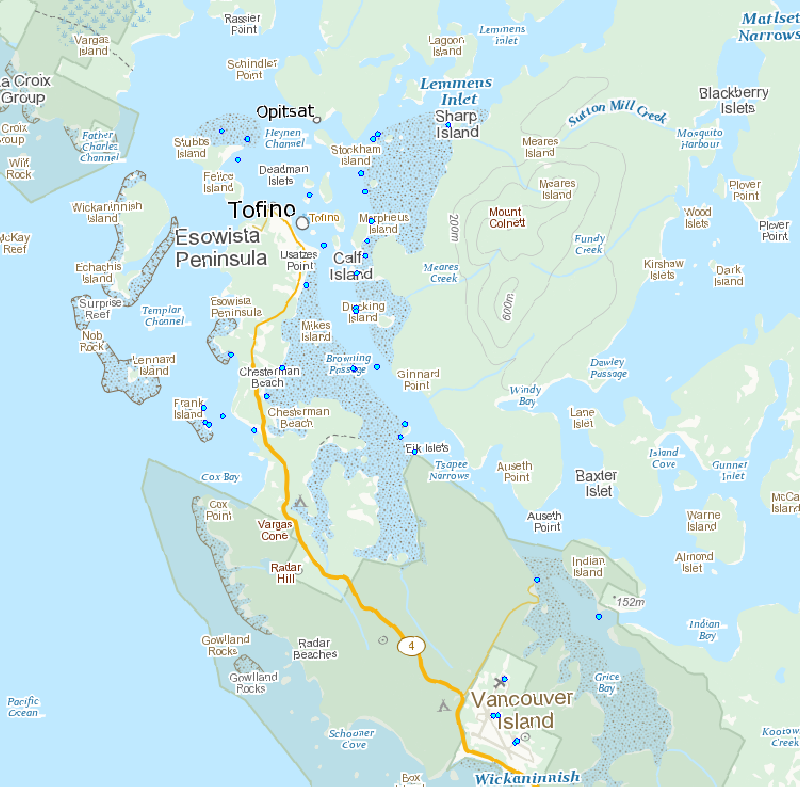
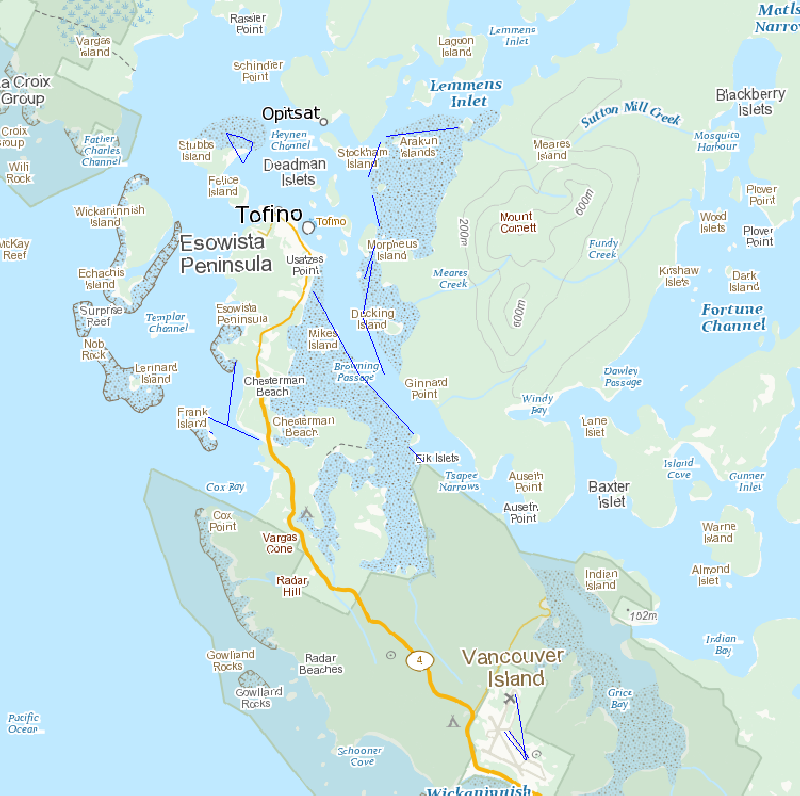
These shorebird surveys are conducted intermittently at a series of sites near the town of Tofino on the west coast of Vancouver Island, British Columbia, during northward (April to May) and southward migration (July to November). This survey includes all shorebird species. Surveyors used binoculars or a spotting scope to count the total number of shorebirds present within the natural boundaries of each survey site during the northward and/or southward migration periods. They used a boat to count birds within the entire area of Arakun Flats and Ducking Flats by traveling along the outer edge of the mudflats, and by stopping at standardized vantage points on land. They also used a boat to view as much area as possible within Maltby Slough, South Bay and Grice Bay from the openings to each of these bays. Surveyors walked the entire length of Chesterman Beach including the tombolo to Frank Island. Surveys were done at least twice a week at each site. Most boat surveys began at low tide when the mudflats were exposed and continued on the rising tide. Road accessible sites were usually surveyed during the hour before high tide or at high tide in 2011. Surveys were not conducted in weather that reduced visibility or made boat travel unsafe (heavy rain or high wind). Surveyors counted birds individually when they were within flocks of fewer than 200 birds. They estimated the size of larger flocks by counting 50 or 100 birds and then judged how many similar-sized groups made up the entire flock. Distant flocks were recorded as small or large shorebirds and assumed to have the same species composition as those closer to shore in 1995 or identified to species group and recorded as either “dowitchers” or “peeps” in 2011.
-
Communities in east Hudson Bay and James Bay are concerned about ecosystem changes observed in recent decades, particularly related to sea-ice conditions, and also about potential impacts of contaminants from long-range atmospheric transport and regional human activities. The Arctic Eider Society’s Community-Driven Research Network (CDRN) was established to measure and better understand large-scale cumulative environmental impacts in east Hudson Bay and James Bay. Building on CDRN collaborations and activities in five communities (Sanikiluaq, Kuujjuaraapik, Inukjuak, Umiujaq, Chisasibi), this Northern Contaminants Program (NCP) community-based project generated new information on metal bioaccumulation that provide a regionally integrated perspective on metal exposure in the marine environment of east Hudson Bay and James Bay.
-
Survey transects is a line feature class containing transects completed in 2011.
-
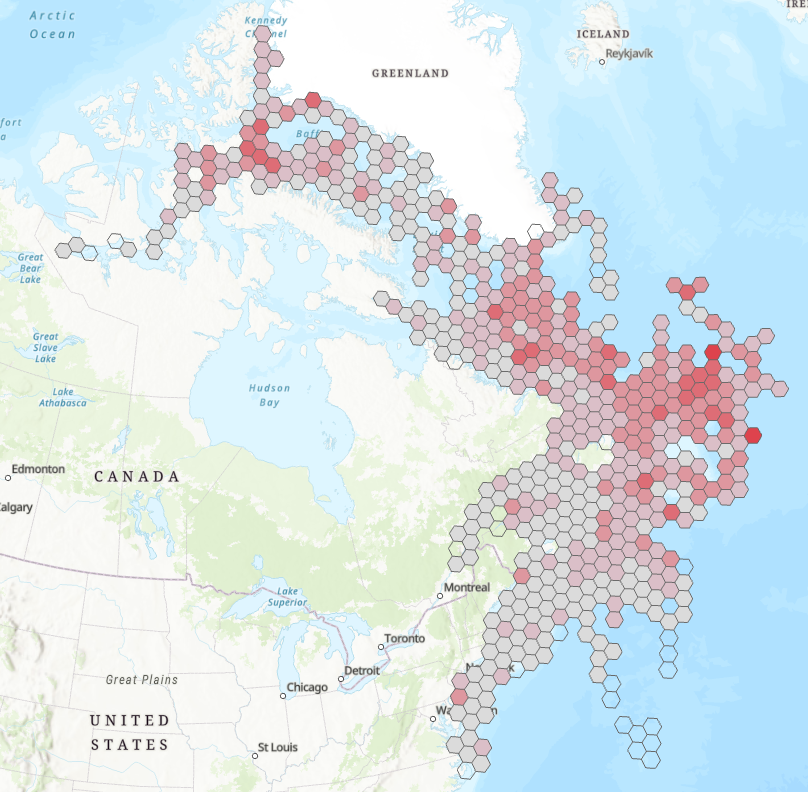
The atlas provides printable maps, Web Services and downloadable data files representing seabirds at-sea densities in eastern Canada. The information provided on the open data web site can be used to identify areas where seabirds at sea are found in eastern Canada. However, low survey effort or high variation in some areas introduces uncertainty in the density estimates provided. The data and maps found on the open data web site should therefore be interpreted with an understanding of this uncertainty. Data were collected using ships of opportunity surveys and therefore spatial and seasonal coverage varies considerably. Densities are computed using distance sampling to adjust for variation in detection rates among observers and survey conditions. Depending on conditions, seabirds can be difficult to identify to species level. Therefore, densities at higher taxonomic levels are provided. more details in the document: Atlas_SeabirdsAtSea-OiseauxMarinsEnMer.pdf. By clicking on "View on Map" you will visualize a example of the density measured for all species combined from April to July - 2006-2020. ESRI REST or WMS map services can be added to your web maps or opened directly in your desktop mapping applications. These are alternatives to downloading and provide densities for all taxonomical groups and species as well as survey effort.