
RI_637
Type of resources
Topics
Keywords
Contact for the resource
Provided by
Years
Formats
Representation types
Update frequencies
status
-
Attribute data table which contains survey effort values for each season, total bird density, species richness value, species at risk score, and grid cell importance score.
-
The data consists of temperature indices based on homogenized daily maximum and minimum temperatures at 338 locations across Canada, and of precipitation indices based on adjusted daily rainfall, daily snowfall and daily precipitation amounts at 463 locations across the country. These indices were selected for their relevance to social and economic impact assessment in Canada and for the insights they could provide regarding changes in extreme climate conditions. Please refer to the papers below for detailed information regarding the adjustment procedures and the trends in the indices.
-
Sidney Island Shorebirds Survey peep counts.
-
The Homogenized Surface Pressure data consist of monthly, seasonal and annual means of hourly sea level and station pressure (hectopascals) for 626 locations in Canada. Homogenized climate data incorporate adjustments (derived from statistical procedures) to the original station data to account for discontinuities from non-climatic factors, such as instrument changes or station relocation. The time periods of the data vary by location, with the oldest data available from 1953 at some stations to the most recent update in 2014. Data availability over most of the Canadian Arctic is restricted to 1953 to present. The data will continue to be updated every few years (as time permits).
-
Precipitation measurements in the Environment and Climate Change Canada (ECCC) surface network are a necessary component for monitoring weather and climate and are required for flood and water resource forecasting, numerical weather prediction and many other applications that impact the health and safety of Canadians. Beginning in the late 1990s, the ECCC surface network began a transition from manual to automated precipitation measurements. Advantages to increased automation include enhanced capabilities for monitoring in remote locations and higher observation frequency at lower cost. However, transition to automated precipitation gauges has resulted in new challenges to data quality, accuracy, and homogenization. Automated weighing precipitation gauges used in the ECCC operational network, because of their physical profile, tend to measure less precipitation falling as snow because lighter particles (snow) are deflected away from the collector by the wind flow around the gauge orifice. This phenomenon of wind-induced systematic bias is well documented in the literature. The observation requires an adjustment depending on gauge and shield configuration, precipitation phase, temperature, and wind speed. Hourly precipitation, wind speed, and temperature for 397 ECCC automated surface weather stations were retrieved from the ECCC national archive. Climate Research Division (CRD) selected this sub-set of stations because they are critical to the continuity of various climate analysis. The observation period varies by station with the earliest data series beginning in 2001 (with most beginning in 2004). The precipitation data was quality controlled using established techniques to identify and flag outliers, remove spurious observations, and correct for previously identified filtering errors. The resulting hourly precipitation data was adjusted for wind bias using the WMO Solid Precipitation Inter-Comparison Experiment (SPICE) Universal Transfer Function (UTF) equation. A full description of this data set, including the station locations, data format, methodology, and references are included in the repository.
-
Wild fish community data (species, abundance, diversity, length, weight) for 2013 and 2019 are now available for tributaries of the Athabasca River (rivers Steepbank, Ells, Firebag, High Hills, Dunkirk, Horse, Muskeg, Tar and Calumet) and 2017 data for rivers and creeks adjacent to Christina Lake (Christina River, Sunday Creek, Birch Creek, Sawbones Creek, Jackfish Creek and Unnamed Creek). The composition and diversity of the fish communities in these waterbodies have been evaluated over time to identify changes in the presence and abundance of fish species in these waterbodies adjacent to SAGD oil sands mining activity and at sites that are outside of the Athabasca Oil Sands deposit and not influenced by mining activities. Not all waterbodies are adjacent to mining activities and these provide some information as to the natural variability and stability of these fish communities over time. This involved establishing baseline conditions in fish communities in the fall of 2013, 2017 and 2019. This baseline data has assisted in tracking changes in fish communities of these waterbodies over time. Fish community assessments (non-lethal sampling) were carried out in a reach of river using a Smith-Root 12B backpack, Smith-Root LR-24 backpack and or seine at the sites identified in Section 2.3. Length, weight, species identification, and external assessment were performed on fish collected. Fish were then returned to the water at the site of capture. This fish community assessment work commenced September 17th to 27th, 2013, October 3rd to 8th, 2017 and September 24th to October 2nd, 2019. This monitoring activity compliments and supports the Wild Fish Health program.
-
Wild fish health data (length, weight, gonad size, etc.) are now available for trout perch collected from the Athabasca and Peace Rivers; white sucker collected from the Athabasca River; longnose sucker collected from the Peace River; slimy sculpin collected from the Steepbank River; lake chub from Alice Creek, the Ells and Dover Rivers; and longnose dace from the Mackay River. Contaminants data available for walleye collected from the Athabasca and Peace Rivers. For each of these data sets, upstream reference areas are provided for comparison to downstream developed sites. Reference data are currently being evaluated for variability between years to develop triggers, and these triggers are essential to eventually quantify potential effects at exposed sites. Using existing critical effect sizes developed in the Environmental Effects Monitoring programs for pulp and paper and metal mining effluents, condition endpoints in white sucker were increased within the deposit. Slimy sculpin condition and reproductive endpoints are also exceeding effect sizes downstream of development sites. This data is now being used to predict future fish health endpoints within sites, between sites and relative to reference variability to help assess change in fish health.
-
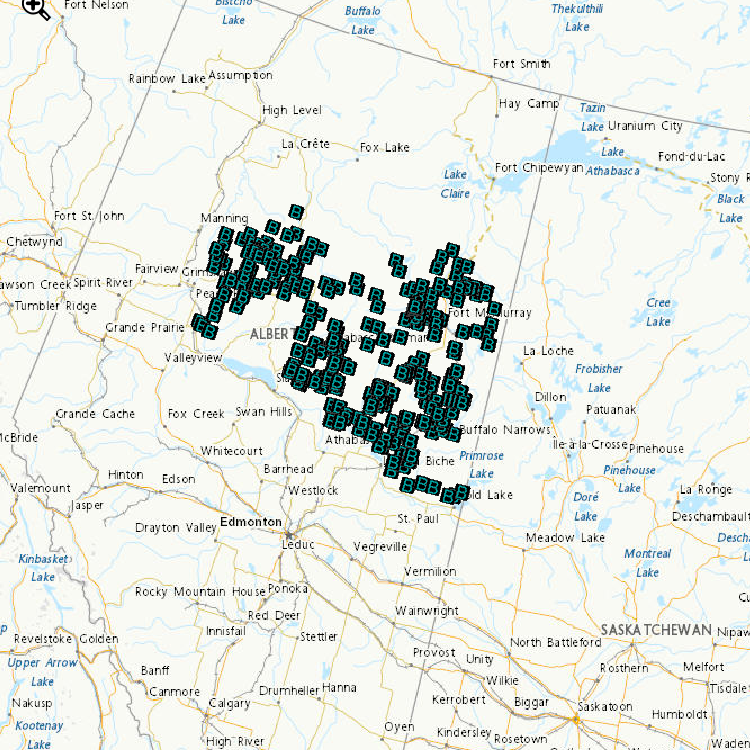
Environment and Climate Change Canada’s cause-effect monitoring is focused on understanding how boreal songbirds, including several Species at Risk, are affected by human activity in the oil sands area, particularly the impact of the physical disturbance of forested habitats from exploration, development and construction of oil sands. Determining the abundance of songbird species associated with various habitat type(s) and understanding how the type and number of birds varies with type and amount of habitat, are important components of assessing the effect of habitat disturbance. Regional-scale monitoring focuses on understanding how and why boreal songbirds, including several Species at Risk, are affected by human activity across the Peace, Athabasca and Cold Lake oil sands area. Local-scale projects focus on addressing gaps in our understanding of complex response patterns at regional scales by targeting specific habitats or development features of interest. These data contribute to: a. improving the design of monitoring programs; b. explaining observed trends in populations (why bird populations are increasing or decreasing); c. predicting population sizes within the oil sands area; and d. assessing the individual, additive and cumulative effects of oil sands and other resource development on boreal birds. Data are used by ECCC and our partners to develop new models and increase the robustness of existing models of bird responses to habitat and disturbance. Because models can be used to predict outcomes of future land management scenarios, these models can assist decision-making by helping evaluate land-use choices before impacts are directly observed.
-
The Point Lepreau Bird Observatory (PLBO), located in Point Lepreau, New Brunswick, was created as a project of the Saint John Naturalists’ Club (SJNC) in late 1995. The SJNC began accumulating data on bird migration through the Bay of Fundy in spring and fall in 1996. Migration data are collected daily using a sampling method with protocols adapted from Hussell and Ralph (1998). Migration counts using the Hussell and Ralph (1998) count protocol involve a four-hour Count Period consisting of a series of 15-minute counts, each followed by a rest period of equal length. Each Count Period consists of eight 15-minute counts, for a total of two hours, and eight 15-minute periods of rest. Observations are conducted from a permanent observatory building from mid-March to mid-May and from mid-September to mid-November. Observers count all birds seen and since Point Lepreau projects southward into the Bay, birds in spring migration are travelling east when passing it while birds in fall are travelling west. Since the year 2000, counts in spring have been under the supervision of a contracted Official Observer, normally assisted by up to three volunteers. The data are split in to a conditions file and an observations file. The conditions data includes information on weather conditions, sea states and times and durations of each count. The observations data includes observations of birds by species, including numbers of individuals observed and direction of flight. Birds travelling in different directions are recorded separately as are birds resting or feeding on the water.
-
The Stanley Park Winter Waterbird Survey, 1995-2019, was made possible through a co-operative effort between Environment and Climate Change Canada, the British Columbia Institute of Technology’s Wildlife and Recreation Program, and the Stanley Park Ecology Society. The intent of the survey is to collect data to estimate the presence, abundance, and distribution of waterbirds along the Stanley Park foreshore in Vancouver, British Columbia, Canada. This dataset is a compilation of species-level occurrence, abundance and distribution data of marine birds collected systematically for the last 23 years (1995-2019) on roughly a weekly basis between September and April each year along the Stanley Park seawall. This long-term dataset of marine birds, has a high value for analysing spatiotemporal trends in marine bird species.