
geoscientificInformation
Type of resources
Topics
Keywords
Contact for the resource
Provided by
Years
Formats
Representation types
Update frequencies
status
-
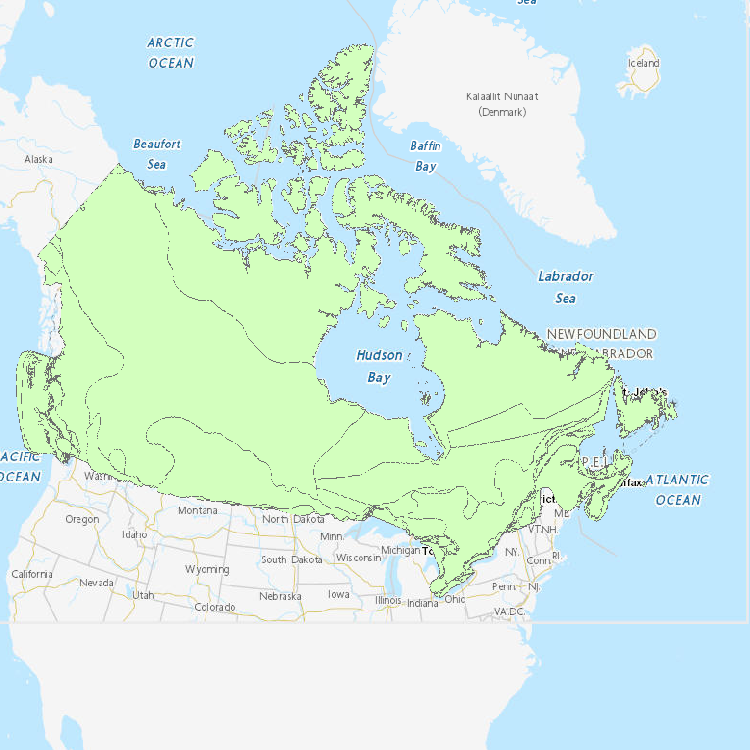
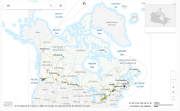
River ice is a known occurrence in cold climate hydrological systems. The annual cycle of formation, growth, decay and clearance of river ice can include low flows and ice jams, as well as mid-winter and spring break-up events. Reports and associated data on river ice occurrence are often limited to site and season specific studies. Within Canada, the National Hydrometric Program (NHP) operates a network of gauging stations with water level as the primary measured variable. It is well known by the hydrologic community that river ice related information can be extracted from water level records. Near two decades ago, the Water Science and Technology Directorate of Environment and Climate Change Canada initiated a long-term effort to compile, archive and extract river ice related information from hydrometric records. As a result, this work has delivered an original research data set: the Canadian River Ice Database (CRID). The CRID includes near 71,000 river ice variables from a network of 196 NHP sites throughout Canada in operation within the period 1894 to 2015. The task of compiling this database involved manual extraction, data entry and input of more than 460,000 information fields on water level, discharge, date, time and data quality rating. In excess of 100,000 paper and digital files were reviewed with the network representing over 10,000 station years of active operation. This database follows up on several earlier efforts to compile information on river ice and expands the scope and detail for use in Canadian river ice research and applications. At each location, time series of up to 15 river ice variables specific to occurrence of freeze-up and winter-low events, occurrence of mid-winter break-up, ice thickness, spring break-up and maximum open-water level is compiled. Following the Government of Canada Open Data initiative, this original river ice data set is available to the public.
-
Predicted and actual counts of sandpipers utilizing the portion of Roberts Bank along “Brunswick dike” (the shoreline between the base of the Roberts Bank Coal Port causeway northwestwards to Brunswick Point at the mouth of Canoe Pass).
-
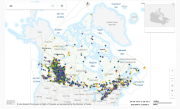
This national dataset contains geographic range data for 488 Species at risk based on NatureServe data, SAR recovery strategies, Environment Canada resources and COSEWIC status reports.
-
High-resolution ground terrain elevational data are key to assessing habitat conditions, surface water connectivity and environmental change in the Peace-Athabasca Delta (PAD), Northern Alberta. LiDAR (Light Detection and Ranging) is a remote sensing technology that has recently become more common in geospatial related projects and is currently one of the best methods for surveying large areas to obtain surface elevations. As part of the Oil Sands Monitoring (OSM) Program, aerial LiDAR surveys were conducted over approximately 3500 km2 of the PAD at the end of summer 2019 to cover spatial data gaps. The LiDAR point cloud elevational data are offered as 1 km2 tiles of classified (unclassified, ground, low point noise, water, high noise) referenced to UTM NAD83 (CSRS) Zone 12 horizontal and CGVD2013 (Epoch 2010) vertical reference systems, with a RMSE of approximately 0.10 m. Following the Government of Canada Open Data initiative, this original elevational data set is available to the public.
-

The Canadian Environmental Sustainability Indicators (CESI) program provides data and information to track Canada's performance on key environmental sustainability issues. The Water quantity in Canadian rivers indicators provide information about the state of the amount of surface water in Canada and its change through time to support water resource management. They are used to provide information about the state and trends in water quantity in Canada. Information is provided to Canadians in a number of formats including: static and interactive maps, charts and graphs, HTML and CSV data tables and downloadable reports. See the supplementary documentation for the data sources and details on how the data were collected and how the indicator was calculated.
-
The Canadian Environmental Sustainability Indicators (CESI) program provides data and information to track Canada's performance on key environmental sustainability issues. The Water quality in Canadian rivers indicators provide a measure of the ability of river water across Canada to support plants and animals. At each monitoring site, water quality data are compared to water quality guidelines to create a rating for the site. If measured water quality is below the guidelines, it can maintain a healthy ecosystem. Water quality at a monitoring site is considered excellent when substances in a river are very rarely measured above their guidelines. Conversely, water quality is rated poor when measurements are usually above their guidelines, sometimes by a wide margin. These indicators provide information about the state of surface water quality and its change through time, to support water resource management. Information is provided to Canadians in a number of formats including: static and interactive maps, charts and graphs, HTML and CSV data tables and downloadable reports. See the supplementary documentation for the data sources and details on how the data were collected and how the indicator was calculated. Canadian Environmental Sustainability Indicators - Home page: https://www.canada.ca/environmental-indicators
-
The Canadian Environmental Sustainability Indicators (CESI) program provides data and information to track Canada's performance on key environmental sustainability issues. The Air quality indicators track ambient concentrations of fine particulate matter, ground-level ozone, sulphur dioxide, nitrogen dioxide, and volatile organic compounds at the national, regional and urban levels and at local monitoring stations. The national and regional indicators are presented with their corresponding Canadian Ambient Air Quality Standard when available. Canadians are exposed to air pollutants on a daily basis, and this exposure can cause adverse health and environmental effects. Information is provided to Canadians in a number of formats including: static and interactive maps, charts and graphs, HTML and CSV data tables and downloadable reports. See the supplementary documentation for the data sources and details on how the data were collected and how the indicator was calculated.
-
The Canadian Environmental Sustainability Indicators (CESI) program provides data and information to track Canada's performance on key environmental sustainability issues. The Air pollutant emissions indicators track emissions from human activities of 6 key air pollutants: sulphur oxides, nitrogen oxides, volatile organic compounds, ammonia, carbon monoxide and fine particulate matter. Black carbon, which is a component of fine particulate matter, is also reported. Sectoral indicators on air pollutant emissions from transportation, off-road vehicles and mobile equipment, electric utilities and the oil and gas industry provide additional analysis on the largest sources of Canada's air pollutant emissions. For each air pollutant, the indicators are provided at the national and provincial/territorial levels. They also identify the major sources of emissions and provide links to detailed information on air pollutant emissions from facilities. The Air pollutant emissions indicators are intended to inform Canadians and decision makers about progress made towards reducing emissions from human-related sources of air pollutants and about the effectiveness of emission reduction measures implemented to improve ambient air quality in Canada. Information is provided to Canadians in a number of formats including: static and interactive maps, charts and graphs, HTML and CSV data tables and downloadable reports. See the supplementary documentation for data sources and details on how those data were collected and how the indicator was calculated.
-
The Canadian Environmental Sustainability Indicators (CESI) program provides data and information to track Canada's performance on key environmental sustainability issues. The Air quality indicators track ambient concentrations of fine particulate matter, ground-level ozone, sulphur dioxide, nitrogen dioxide, and volatile organic compounds at the national, regional and urban levels and at local monitoring stations. The national and regional indicators are presented with their corresponding Canadian Ambient Air Quality Standard when available. Canadians are exposed to air pollutants on a daily basis, and this exposure can cause adverse health and environmental effects. Information is provided to Canadians in a number of formats including: static and interactive maps, charts and graphs, HTML and CSV data tables and downloadable reports. See the supplementary documentation for the data sources and details on how the data were collected and how the indicator was calculated.
-
The Canadian Environmental Sustainability Indicators (CESI) program provides data and information to track Canada's performance on key environmental sustainability issues. The Air pollutant emissions indicators track emissions from human activities of 6 key air pollutants: sulphur oxides, nitrogen oxides, volatile organic compounds, ammonia, carbon monoxide and fine particulate matter. Black carbon, which is a component of fine particulate matter, is also reported. Sectoral indicators on air pollutant emissions from transportation, off-road vehicles and mobile equipment, electric utilities and the oil and gas industry provide additional analysis on the largest sources of Canada's air pollutant emissions. For each air pollutant, the indicators are provided at the national and provincial/territorial levels. They also identify the major sources of emissions and provide links to detailed information on air pollutant emissions from facilities. The Air pollutant emissions indicators are intended to inform Canadians and decision makers about progress made towards reducing emissions from human-related sources of air pollutants and about the effectiveness of emission reduction measures implemented to improve ambient air quality in Canada. Information is provided to Canadians in a number of formats including: static and interactive maps, charts and graphs, HTML and CSV data tables and downloadable reports. See the supplementary documentation for data sources and details on how those data were collected and how the indicator was calculated.