
RI_541
Type of resources
Topics
Keywords
Contact for the resource
Provided by
Years
Formats
Representation types
Update frequencies
status
-
Monitor variations in seabird numbers and colony size in the St. Lawrence system. Survey of over 20 species of seabirds and herons during the breeding season, in order to monitor population dynamics through time and space. Seabird populations are influenced by food abundance and quality. There is actually more than 1,000,000 birds from more than 20 different species that breed in nearly 1,000 active colonies. Plongeon du Pacifique/Pacific Loon/Gavia Pacifica, Plongeon catmarin/Red-throated Loon/Gavia stellata, Macareux moine/Atlantic Puffin/Fratercula arctica, Guillemot à miroir/Black Guillemot/Cepphus grylle, Guillemot marmette/Common Murre/Uria aalge, Guillemot de Brünnich/Thick-billed Murre/Uria lomvia, Petit Pingouin/Razorbill/Alca torda, Mouette tridactyle/Black-legged Kittiwake/Rissa tridactyla, Goéland marin/Great Black-backed Gull/Larus marinus, Goéland argenté/Herring Gull/Larus argentatus, Goéland à bec cerclé/Ring-billed Gull/Larus delawarensis, Mouette rieuse/Common Black-headed Gull/Larus ridibundus, Sterne caspienne/Caspian Tern/Sterna caspia, Sterne pierregarin/Common Tern/Sterna hirundo, Sterne arctique/ArcticTern/Sterna paradisaea, Sterne de Dougall/Roseate Tern/Sterna dougallii, Océanite cul-blanc/Leach's Storm-Petrel/Oceanodroma leucorhoa, Fou de Bassan/Northern Gannet/Morus bassanus, Grand Cormoran/Great Cormorant/Phalacrocorax carbo, Cormoran à aigrettes/Double-crested Cormorant/Phalacrocorax auritus, Eider à duvet/Common Eider/Somateria mollissima, Grand Héron/Great Blue Heron/Ardea herodias, Bihoreau gris/Black-crowned Night-Heron/Nycticorax nycticorax.
-
With the changing climate conditions, marine traffic along Canada’s coastal regions has increased over the past couple of decades and the need to improve our state of preparedness for oil-spill-related emergencies is critical. Baseline coastal information, such as shoreline form, substrate, and vegetation type, is required for prioritizing operations, coordinating onsite spill response activities (i.e. Shoreline Cleanup Assessment Technique [SCAT]), and providing information for wildlife and ecosystem management. Between 2010 and 2017, georeferenced high-definition videography and photos were collected for various study sites across coastal Canada. The study areas include Beaufort Sea, Mackenzie Delta channels and Banks Island in the western Canadian Arctic; James Bay, Hudson Bay, Nunavik, Resolute Bay, Victoria Strait, Baffin Island and Coronation Gulf in the eastern Canadian Arctic; Labrador, Bay of Fundy and Chedabucto Bay in Atlantic Canada and Kitimat, Haida Gwaii and Burrard Inlet in the northern Pacific. Data was collected during ice-free and low tide conditions (where applicable) between July and September. Low-altitude helicopter surveys were conducted at each study site to capture video of the shoreline characteristics. In addition to acquiring videography, ground-based observations were recorded in several locations for validation. Shoreline segmentation was then carried out by manual interpretation of the oblique videography and the photos aided by ancillary data. This involved splitting and classifying the shoreline vectors based on homogeneity of the upper intertidal zone. Detailed geomorphological information (i.e. shoreline type, substrate, slope, height, accessibility etc.) describing the upper intertidal, lower intertidal, supratidal and backshore zones was extracted from the video and entered into a geospatial database using a customized data collection form. In addition, biological characteristics like biobands, water features, fauna, human use etc. observed along the coast were recorded. The data was also validated through ground samples (when available) and a second interpreter QA (quality analysis) was performed on each dataset (excluding Nunavik) to ensure high quality and consistency. The final dataset contains segments ranging in length from 150 metres to 2500 metres. In total, from 2010 to 2017, within the 14 study sites, about 26,150 km of shoreline were mapped.
-
Long-term freshwater quality monitoring data for Rainy River / Lake of the Woods Watershed for the past 15 years or longer for nutrients, metals, major ions, and other physical-chemical variables are included in this dataset. Monitoring is conducted by Environment and Climate Change Canada (ECCC) to assess water quality status and long-term trends, detect emerging issues, establish water quality guidelines and track the effectiveness of remedial measures and regulatory decisions. The information informs and supports the Fresh Water Action Plan.
-

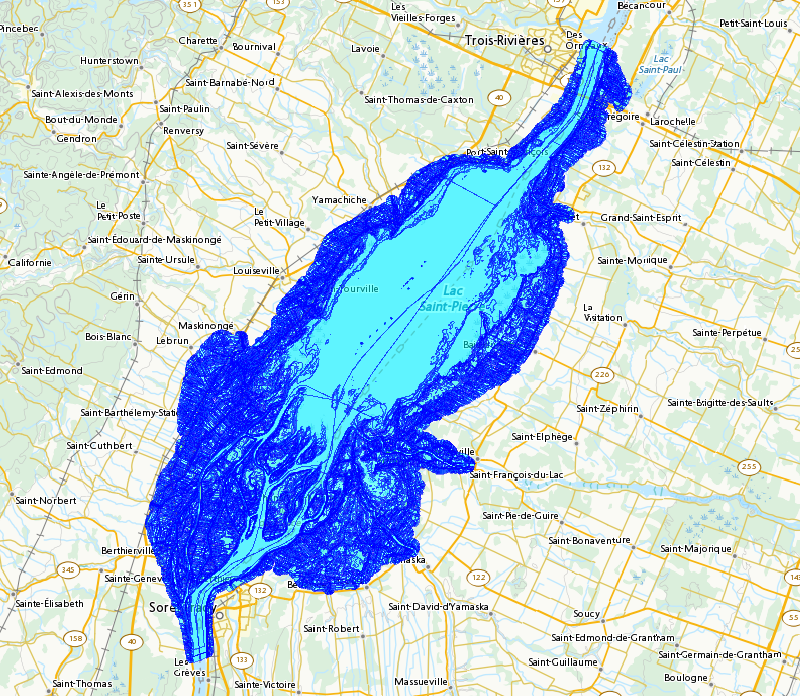
Recent efforts to model spring breeding habitats of fish in the St. Lawrence have revealed significant gaps in land use descriptions for the floodplains of Lac Saint-Pierre. In order to fill these gaps, aerial photographs taken in 1950, 1964 and 1997 were assembled in mosaic fashion and then digitized, georeferenced and interpreted to categorize 28 fish habitat classes. For each of the three periods, interpretation made it possible to categorize and georeference polygons (e.g. wet meadows, perennial crops) and linear elements (e.g. windbreaks, riparian strips, roads) and to compile these with their properties (habitat class, length, perimeter, surface area). To facilitate and refine subsequent analyses, all polygons and linear elements were delineated with the aid of several layers of information, including the boundaries of regional county municipalities, drainage basins, several flood scenarios, and three large units: the north and south shores of Lac Saint-Pierre and the Sorel archipelago. This report describes the methods used and the constraints encountered; it also presents certain interpretation limits and a summary analysis of habitat classes in the three periods studied. A temporal trend analysis of habitat dynamics in the three periods has yet to be completed. Source files containing the data have been published and are available to anyone interested in land use in the floodplains of Lac Saint-Pierre or wishing to extend the study of changes in these landscapes and habitats over the past fifty years, depending on their field of interest (e.g. fish habitats, waterfowl nesting, agricultural landscape).
-
1. Provides public access to real-time instantatenous streamflow collected at over 1800 active locations in Canada. These data are collected under a national program jointly administered under federal-provincial and federal-territorial cost-sharing agreements; 2. Provides public access to archived daily streamflow for stations of interest using search criteria. These data include: daily and monthly mean, max and min of flow. For some sites, annual peaks and extremes are also recorded. Archived streamflow data are disseminated online; 3. Provides public access to a MS Access database file containing archived daily streamflow that users can download to their desktop. These data include: daily and monthly mean, max and min of flow. For some sites, annual peaks and extremes are also recorded. MS Access file is updated quarterly; 4. Provides public access to streamflow statistics for stations of interest using search criteria.
-
This paper presents an analysis of observed and simulated historical snow cover extent and snow mass, along with future snow cover projections from models participating in the 6th phase of the World Climate Research Programme Coupled Model Inter-comparison Project (CMIP6). Where appropriate, the CMIP6 output is compared to CMIP5 results in order to assess progress (or absence thereof) between successive model generations. An ensemble of six observation-based products is used to produce a new time series of historical Northern Hemisphere snow extent anomalies and trends; a subset of four of these products is used for snow mass. Trends in snow extent over 1981-2018 are negative in all months, and exceed -50 x 103 km2 during November, December, March, and May. Snow mass trends are approximately -5 Gt/year or more for all months from December to May. Overall, the CMIP6 multi-model ensemble better represents the snow extent climatology over the 1981-2014 period for all months, correcting a low bias in CMIP5. Simulated snow extent and snow mass trends over the 1981-2014 period are stronger in CMIP6 than in CMIP5, although large inter-model spread remains in the simulated trends for both variables. There is a single linear relationship between projected spring snow extent and global surface air temperature (GSAT) changes, which is valid across all scenarios. This finding suggests that Northern Hemisphere spring snow extent will decrease by about 8% relative to the 1995-2014 level per °C of GSAT increase. The sensitivity of snow to temperature forcing largely explains the absence of any climate change pathway dependency, similar to other fast response components of the cryosphere such as sea ice and near surface permafrost.
-
With the changing climate conditions, marine traffic along Canada’s coastal regions has increased over the past few decades and the need to improve our state of preparedness for oil-spill-related emergencies is critical. Baseline coastal information, such as shoreline form, substrate, and vegetation type, is required for prioritizing operations, coordinating onsite spill response activities (i.e., Shoreline Cleanup Assessment Technique [SCAT]), and providing information for wildlife and ecosystem management. Between 2011 and 2016, georeferenced high-definition videography and photos were collected for various study sites along the east coast. The study areas include Labrador, Bay of Fundy and Chedabucto Bay in Atlantic Canada. Data was collected during ice-free and low tide conditions (where applicable) between July and September. Low-altitude helicopter surveys were conducted at each study site to capture video of the shoreline characteristics. In addition to acquiring videography, ground-based observations were recorded in several locations for validation. Shoreline segmentation was then carried out by manual interpretation of the oblique videography and the photos aided by ancillary data. This involved splitting and classifying the shoreline vectors based on homogeneity of the upper intertidal zone. Detailed geomorphological information (i.e., shoreline type, substrate, slope, height, accessibility etc.) describing the upper intertidal, lower intertidal, supratidal and backshore zones was extracted from the video and entered into a geospatial database using a customized data collection form. In addition, biological characteristics like biobands, water features, fauna, human use etc. observed along the coast were recorded. The data was also validated through ground observations (when available) and a second interpreter QA (quality analysis) was performed on each dataset to ensure high quality and consistency. The final dataset contains segments ranging in length from 150 metres to 2500 metres. In total, from 2011 to 2016, within the 3 study sites, about 1,850 km of shoreline were mapped.
-
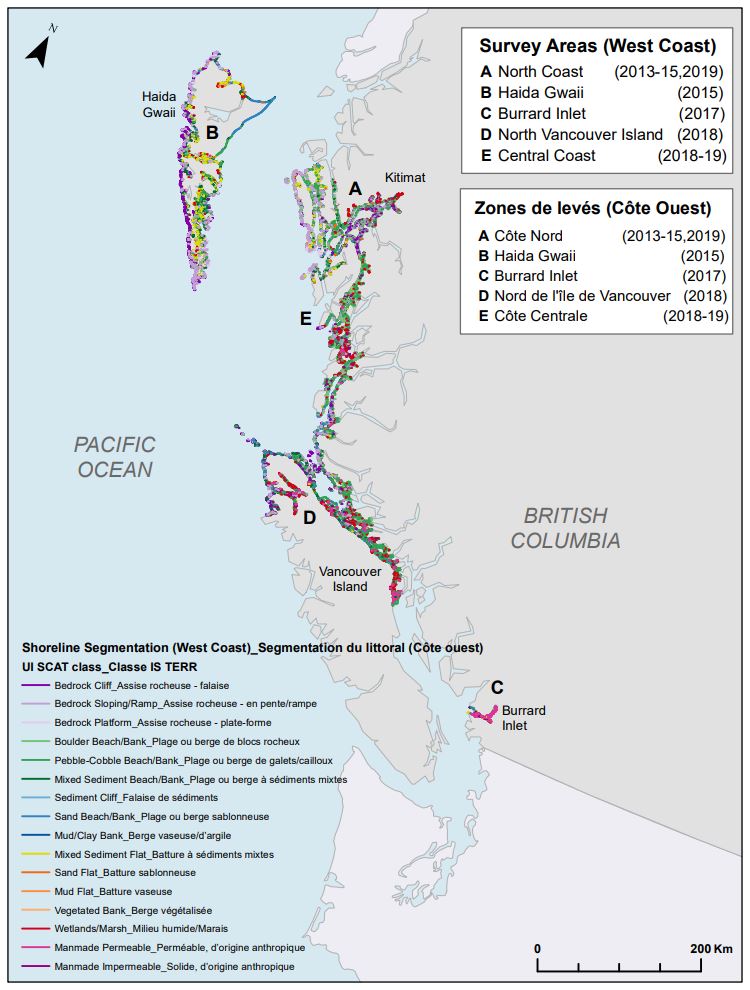
With the changing climate conditions, marine traffic along Canada’s coastal regions has increased over the past couple of decades and the need to improve our state of preparedness for oil-spill-related emergencies is critical. Baseline coastal information, such as shoreline form, substrate, and vegetation type, is required for prioritizing operations, coordinating onsite spill response activities (i.e. Shoreline Cleanup Assessment Technique [SCAT]), and providing information for wildlife and ecosystem management. Between 2013 and 2019, georeferenced high-definition videography and photos were collected for various study sites along the west coast. The study areas include the mainland, inlets, channels and islands along the BC coast starting from Kitimat in the north to Quadra Island in the south, including Haida Gwaii and North Vancouver Island in the west and Burrard Inlet in the extreme south. Data was collected during low tide conditions (where applicable) between July and September. Low-altitude helicopter surveys were conducted at each of the study site to capture video of the shoreline characteristics. In addition to acquiring videography, ground-based observations were recorded in several locations for validation. Shoreline segmentation was then carried out by manual interpretation of the oblique videography and the photos aided by ancillary data. This involved splitting and classifying the shoreline vectors based on homogeneity of the upper intertidal zone. Detailed geomorphological information (i.e. shoreline type, substrate, slope, height, accessibility etc.) describing the upper intertidal, lower intertidal, supratidal and backshore zones was extracted from the video and entered into a geospatial database using a customized data collection form. In addition, biological characteristics like biobands, water features, fauna, human use etc. observed along the coast were recorded. The data was also validated through ground samples (when available) and a second interpreter QA (quality analysis) was performed on the dataset to ensure high quality and consistency. The final dataset contains segments ranging in length from 150 metres (45 metres for study areas surveyed in 2018-19) to 2500 metres. In total, from 2013 to 2019, about 15,000 km of shoreline were segmented.