
2013
Type of resources
Topics
Keywords
Contact for the resource
Provided by
Years
Formats
Representation types
Update frequencies
status
-
Sidney Island Shorebirds Survey peep counts.
-
Wild fish community data (species, abundance, diversity, length, weight) for 2013 and 2019 are now available for tributaries of the Athabasca River (rivers Steepbank, Ells, Firebag, High Hills, Dunkirk, Horse, Muskeg, Tar and Calumet) and 2017 data for rivers and creeks adjacent to Christina Lake (Christina River, Sunday Creek, Birch Creek, Sawbones Creek, Jackfish Creek and Unnamed Creek). The composition and diversity of the fish communities in these waterbodies have been evaluated over time to identify changes in the presence and abundance of fish species in these waterbodies adjacent to SAGD oil sands mining activity and at sites that are outside of the Athabasca Oil Sands deposit and not influenced by mining activities. Not all waterbodies are adjacent to mining activities and these provide some information as to the natural variability and stability of these fish communities over time. This involved establishing baseline conditions in fish communities in the fall of 2013, 2017 and 2019. This baseline data has assisted in tracking changes in fish communities of these waterbodies over time. Fish community assessments (non-lethal sampling) were carried out in a reach of river using a Smith-Root 12B backpack, Smith-Root LR-24 backpack and or seine at the sites identified in Section 2.3. Length, weight, species identification, and external assessment were performed on fish collected. Fish were then returned to the water at the site of capture. This fish community assessment work commenced September 17th to 27th, 2013, October 3rd to 8th, 2017 and September 24th to October 2nd, 2019. This monitoring activity compliments and supports the Wild Fish Health program.
-
The dataset contains the blended (gauge and satellite estimates) monthly mean precipitation rates (unit: mm/day) for Canada for the period from January 1979 to December 2007, at a half degree spatial resolution. Please refer to the paper below for the details of the blending algorithm and input gauge and satellite data. Reference: Lin, A. and X. L. Wang, 2011: An algorithm for Blending Multiple Satellite Precipitation Estimates with in-situ Precipitation Measurements in Canada. JGR-Atmospheres, 116, D21111, doi:10.1029/2011JD016359.
-
During August 2013, September 2013, April 2018, May 2018, and June 2018, a research aircraft was deployed in the oil sands region. The flight paths of the aircraft were designed to measure air pollutants in plumes around the immediate vicinity of the major oil sands surface mining facilities (2013 & 2018) and in-situ mining facilities (2018 only), and downwind of these sources, at various heights above the ground. These flight paths enabled measurements of how concentrations of air pollutants change with elevation in the atmosphere as well as with distance from pollution sources. The aircraft was equipped with a comprehensive suite of instruments to measure gases, particles and meteorological conditions. It is not appropriate to directly compare these short-term data, measured by aircraft at various altitudes above the surface, with ambient air quality objectives for ground-level concentrations. The measurements were made to characterize and improve understanding of the chemical and physical processes that the oil sands pollutants undergo in the atmosphere. The measurements provide information to estimate the quantity and types of pollutants emitted from oil sands operations, to map out how far the pollutants are transported, and to understand how fast they are chemically converted to new forms of pollutants in the atmosphere. This information will be integrated into a comprehensive air quality model that will be used to predict current and future air pollutant levels and surface deposition amounts near to the oil sands and also far downwind. These environmental predictions help identify locations that may experience harmful effects today and/or in the future as the oil sands development expands and multiple pollutants accumulate in the environment. To use these data, they must be linked to the latitude, longitude and altitude information provided in the Flight State Parameters for the Airborne Measurements in the Oil Sands Region – 2013 and 2018 data sets. Flight State Parameters for the Airborne Measurements in the Oil Sands Region – 2013 and 2018 A number of different samples of atmospheric chemistry were collected in 2013 and 2018, along 52 flight paths, over parts of the oil sands region. This link provides the location and atmospheric conditions at the aircraft at the time of sample collection at 1-second time resolution. Combining the location and atmospheric conditions information with chemistry data (below) will help to document the transformation, transport and fate of substances emitted from oil sands development activities. Condensation Particle Number Concentration for the Airborne Measurements in the Oil Sands Region – 2013 and 2018 Particle number concentration measurements are organized by the time of sample collection so that they can be combined with Flight State Parameters for the Airborne Measurements in the Oil Sands Region – 2013 and 2018. The particle number concentration is the number of particles up to 2.5 µm in diameter in a volume of air. There are no environmental guidelines for this parameter. Particle number concentration data can be used with other datasets posted on the portal to quantify the emission, transformation, transport and deposition of substances emitted from oil sands activities. Volatile Organic Compounds from the Airborne Measurements in the Oil Sands Region – 2013 and 2018 Approximately 800 canisters were used to sample the airstream outside of the aircraft for ~20 seconds each (approximately 2 km in distance) during 22 flights flown between August 13 and September 7, 2013. Similarly, an additional 800 canisters were used during 30 flights flown between April 5th, and July 5th, 2018. Each canister sample was analyzed to determine the concentration of 100-154 different volatile organic compounds (VOCs). Many of these organic chemicals are important precursors to formation of ozone and secondary particulate matter. This VOC dataset can be used with other datasets posted on the portal to quantify the emission, transformation, transport and deposition of substances emitted from oil sands activities. The VOC data are organized by the time of sample collection so that they can be combined with the Flight State Parameters for the Airborne Measurements in the Oil Sands Region – 2013 and 2018.
-
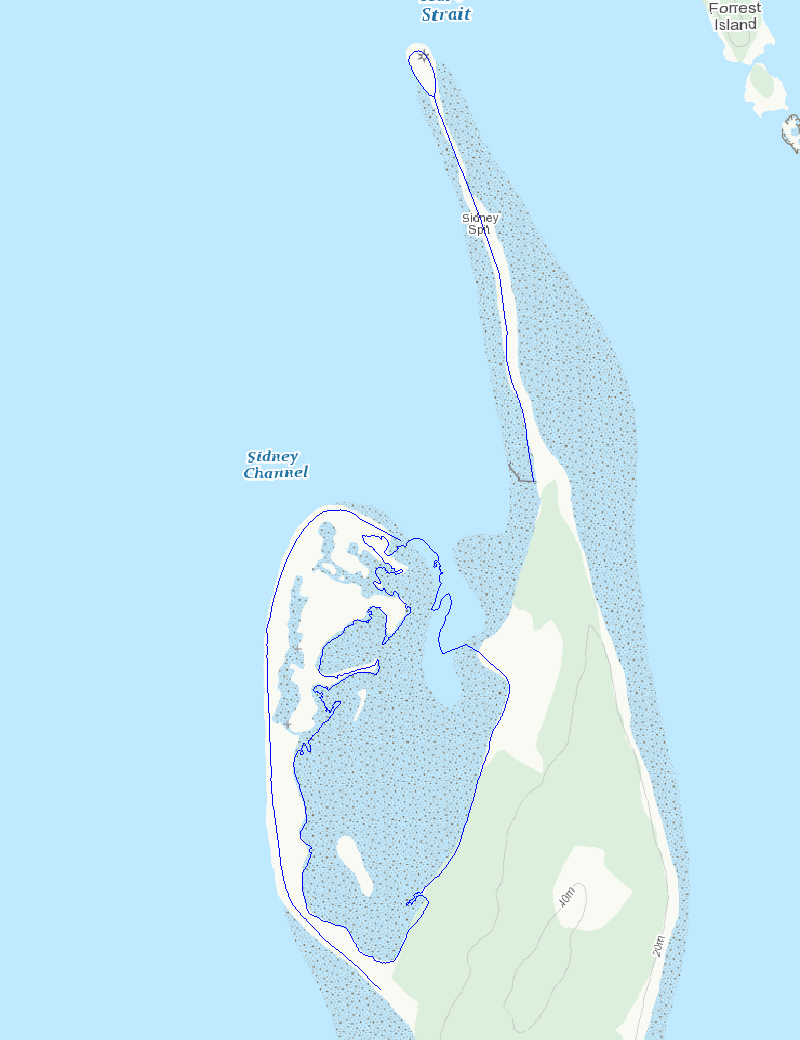
Sidney Island Shorebirds Survey transects line feature.
-
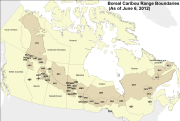
As part of a scientific assessment of critical habitat for boreal woodland caribou (Environment Canada 2011, see full reference in accompanying documentation), Environment Canada's Landscape Science and Technology Division was tasked with providing detailed anthropogenic disturbance mapping across known caribou ranges. This data allowed researchers to better understand the attributes that have a known effect on caribou population persistence. The mapping process was established to create a nationally consistent, reliable and repeatable geospatial dataset that followed a common methodology. The methods developed were focused on mapping disturbances at a specific point of time, and were not designed to identify the age of disturbances, which can be of particular interest for disturbances that can be considered non-permanent, for example cutblocks. The resultant datasets were used for caribou resource selection function,habitat modeling, and assess overall disturbance levels on each caribou ranges. Anthropogenic disturbances within 57 caribou ranges across Canada were mapped. The ranges were defined by individual Provinces and Territories across Canada. Disturbances were mapped across these ranges using 2008-2010 Landsat-5 satellite imagery to provide the most up to date data possible. Originally some areas were mapped to match the date of collected caribou demographic data, however more recent imagery was used and additional disturbance features that were seen since the original mapping date were added. Within the context of this project, anthropogenic disturbance was defined as any human-caused disturbance to the natural landscape that could be visually identified from Landsat imagery at a viewing scale of 1:50,000. A minimum mapping unit (MMU) of 2 ha or approximately 22 contiguous Landsat pixels was selected. Each disturbance feature type was represented in the database by a line or polygon depending on their geometric description. Polygonal disturbances included: cutblocks, mines, reservoirs, built-up areas, well sites, agriculture, oil and gas facilities, as well as unknown features. Linear disturbances included: roads, railways, powerlines, seismic exploration lines, pipelines, dams, air strips, as well as unknown features. For each anthropogenic feature type, a clear description was established (see Appendix 7.2 of the science assessment) to maintain consistency in identifying the various disturbances in the imagery by the different interpreters. Various ancillary vector datasets were used as aids in detecting, classifying and digitizing disturbances on the Landsat imagery (a table listing these datasets and their sources has been included in a separate file). Ancillary data was used to guide interpretation and feature labelling since the ancillary data was often variable across the country in terms of completeness as well as scale. As a result, features were only digitized if they were visible in the Landsat imagery at a viewing scale of 1:50,000. A 2nd interpreter quality control phase was carried out to ensure high quality, completete and consistent data collection. A quality assessment analysis, since an actual accuracy assessment was not possible, using high resolution SPOT imagery was carried out on a sample basis. Results are included in accompanying documentation. The vector data was buffered by 500m (radius) representing the zone of influence impacting boreal caribou herds in order to calculate range disturbance levels as well as for use in the integrated risk assessment analysis. Fire polygons were merged into the anthropogenic footprint in order to create an overall disturbance footprint.
-
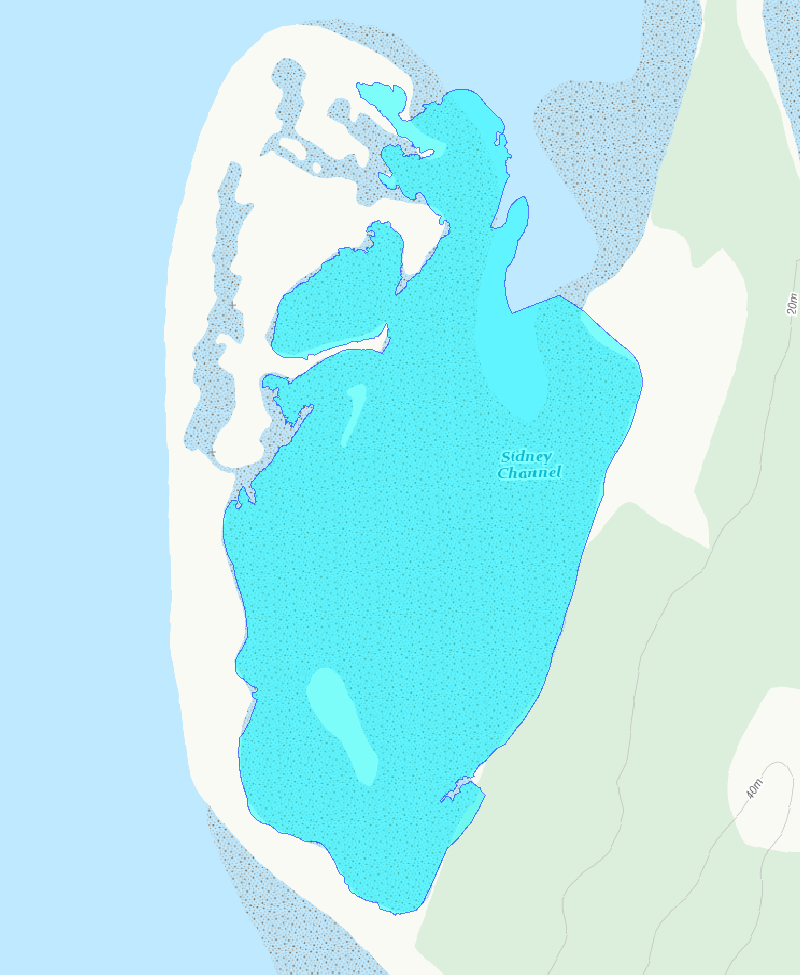
Sidney Island Shorebird Surveys transects area feature.
-
Measurements of the concentrations of air pollutants (Nitric oxide + Nitrogen dioxide - NOx, Sulfur dioxide - SO2, Ozone - O3 and PM2.5) were made at Resolute (2013-2017), Cape Dorset (2013-2017) and Pond Inlet (2018-), in addition to basic meteorology (wind speed and direction, temperature, humidity). The primary objective was to investigate the impact of increasing ship traffic on the air quality in northern communities, in support of Arctic Air Quality model development as well as policy work for the International Maritime Organization. A secondary objective was to evaluate the impact of community diesel power plants on the local air quality. Data consists of quality-controlled 1-minute averages, calibrated in post-processing against traceable standards. Locations: Resolute: 74° 42’ 23”N, 94° 58’ 08” W Cape Dorset: 64° 13’ 48”N, 76° 31’ 49” W Pond Inlet: 72° 41’ 53”N, 77° 58’ 23” W
-
The Canadian Environmental Sustainability Indicators (CESI) program provides data and information to track Canada's performance on key environmental sustainability issues. The Perfluorooctane sulfonate in fish and water indicators provide information on the presence of perfluorooctane sulfonate (PFOS) in the environment and indications of the progress of strategies and policies to reduce or control their occurrence in the environment. These indicators identify the drainage regions where concentrations are below or above the Federal Environmental Quality Guidelines for PFOS in fish and water. Information is provided to Canadians in a number of formats including: static and interactive maps, charts and graphs, HTML and CSV data tables and downloadable reports. See the supplementary documentation for the data sources and details on how the data were collected and how the indicator was calculated.
-
Sediment methylation and demethylation rates were measured by short-term incubations of stable isotopes of inorganic and methylmercury in sediment cores. Methylmercury photodemethylation rates were performed, during which water samples were incubated in the field under different treatments. Some bottles were spiked with methylmercury or complexing agents and scavengers. Labile concentrations of methylmercury were measured in water and sediment using DGT (Diffusive Gradient in Thin Film) samplers. Characterization of the microbial community in sediment and quantification of targeted microbes potentially involved in MeHg cycling were performed using qRT-PCR approaches, cloning and library analyses combined with gel electrophoresis techniques. Methylmercury bioaccumulation at the base of the food web was examined by collecting filamentous benthic algae and chironomid larvae from nearshore and offshore areas in the study lakes.