
2017
Type of resources
Topics
Keywords
Contact for the resource
Provided by
Years
Formats
Representation types
Update frequencies
status
-
This collection of data summarizes the companies and facilities reporting under the Fuels Information Regulations, No. 1. This dataset includes total fuel volumes, sulphur contents and masses, and companies reporting production and/or importation of liquid fuels originating from crude oils, coal or bituminous sand. The information was provided to Environment and Climate Change Canada under the Canadian Environmental Protection Act, 1999.
-
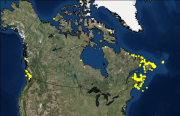
Canada has the longest coastline in the world, measuring 243,790 kilometers. Many of our waterways along the coastline have to be dredged regularly to keep shipping channels and harbours open and safe for navigation; and this material is sometimes best disposed of at sea. Schedule 5 of the Canadian Environmental Protection Act, 1999 (CEPA) defines an exclusive list of materials and substances suitable for disposal at sea in Canada, which is in accordance with the London Protocol (1996). They are: dredged material, fish waste resulting from industrial fish processing operations, ships or platforms, inert and inorganic geological matter, uncontaminated organic matter of natural origin, and bulky substances. The disposal of any substance into the sea, on the seabed, in the subsoil of the seabed, or onto ice, from a ship, an aircraft, a platform or other structure is not allowed unless a permit is issued by the Environment and Climate Change Canada (ECCC) Disposal at Sea Program. Incineration at sea, as well as importing or exporting a substance for disposal at sea is also prohibited. More information on Disposal at Sea is available at: https://www.canada.ca/en/environment-climate-change/services/disposal-at-sea.html The Active and Inactive Disposal at Sea Sites in Canadian Waters dataset provides spatial and related information of at-sea disposal sites approved for use in Canada in the last ten years and that remain open for consideration for additional use. Any additional use of a disposal site must be conducted in accordance with the terms and conditions of a valid Disposal at Sea permit. The dataset may be of use in relation to Disposal at Sea permit applications. For some Disposal at Sea permit applications the data may be of use in assessing serious harm to fish under the Fisheries Act and assessing interference with navigation under the Navigation Protection Act.
-
Dataset contains laboratory-studied Fathead minnow (Pimephales promelas) survival when exposed to bitumen sediments from the oil sands region of northern Alberta, cut through the McMurray Formation (MF). These are the results of the toxicological exposures, when Fathead minnow embryos were exposed to water from simulated rainfall on the river sediments.
-
Information received in response to notices published in the Canada Gazette under section 71 of the Canadian Environmental Protection Act (CEPA 1999). These notices target chemical substances of interest under the Chemicals Management Plan.
-
The Canadian Breeding Bird Census (BBC) Database contains data for 928 breeding bird plot censuses representing all known censuses of breeding birds carried out in Canada during the period 1929–1993. The 928 records in the database represent 640 unique census plots located in all provinces and territories, except Prince Edward Island. The BBC, which was replaced by the current Breeding Bird Survey, is one of the longest-running surveys of bird populations in North America, and was designed to help determine abundance and distribution patterns of bird species. An important feature of the BBC Database is the habitat data associated with each census plot. The most prevalent vegetation species in different layers (canopy, shrub and ground cover) were recorded to reflect the assumption that birds respond principally to vegetative structure.
-
This collection of data summarizes the companies reporting under the Renewable Fuels Regulations. This data set includes total liquid petroleum fuel volumes, renewable fuel volumes, and compliance unit creation. This data set also includes information on compliance by company. The information was provided to Environment and Climate Change Canada under the Canadian Environmental Protection Act, 1999.
-
This dataset includes all significant new activity (SNAc) orders and notices published under the authority of the Canadian Environmental Protection Act, 1999 (CEPA). The SNAc provisions of CEPA may be applied to a substance or living organism when Environment and Climate Change Canada and Health Canada suspect that a significant new activity in relation to the substance or living organism may pose new or increased risks to the environment or to human health. Information is organized by substance and includes links to relevant Canada Gazette publications. Confidential accession numbers and masked names have been presented for confidential substances. Although great care has been taken to ensure the information herein accurately reflects the requirements prescribed in CEPA, you are advised that, should any inconsistencies be found, the legal documents, published in the Canada Gazette, will prevail. Please note that substances on the Domestic Substances List (DSL) may be presented with a flag next to the substance identification number in official Canada Gazette publications. These flags are included in a separate column in the dataset, and are as follows: S: The “S” flag indicates that the SNAc provisions of CEPA apply to the substance. S': The “S'” (S prime) flag indicates that the SNAc provisions of CEPA apply to a substance that was already listed on the DSL. P: The “P” flag indicates that the substance was assessed and added to the DSL on the basis that it met the Reduced Regulatory Requirement polymer criteria. T: The “T” flag indicates that the substance was manufactured or imported during the transitional period (January 1, 1987 to July 1, 1994). N: The “N” flag indicates that the substance was manufactured or imported after July 1, 1994.
-
Water Quality Monitoring on Tributaries in the Athabasca River Oil Sands Region Ells River (EL1, ELLS RIFF 2, ELLS RIFF5 [2012-2015]) Mackay River (MA1 [2012-2015], MA2 [2013-2015]) Steepbank River (STB RIFF1, STB WSC, STB RIFF7, STB RIFF10 [2012-2015]) Firebag River (FI1, FI WSC [2012-2015]) Muskeg River (MU1 [2012-2015]), MU6 [2012-2015]), MU7 [2012]) High Hills River (HIHI1 [2013-2015]) Water quality of tributaries in the Athabasca River oil sands region is heavily influenced by the presence of the underlying Cretaceous bedrock, which is comprised of shale, sandstone and limestone. The waters are moderately hard (average alkalinity of 114 mg l-1 CaCO3) because of their mineral content, particularly magnesium (average 8.62 mg l-1), calcium (average 28.06 mg l-1) and bicarbonate (138.53 mg l-1). This mineral content results in an average conductivity of 245 +/- 4 µS cm-1 and total dissolved solids concentration of 140 +/- 2 ppm. Concentrations of nitrogen and phosphorus (indicators of nutrient status) are typically low to moderate, averaging 0.14 mg l-1 total phosphorus, 0.03 mg l-1 total dissolved phosphorus, 0.92 mg l-1 total nitrogen, 0.09 mg l-1 nitrogen as nitrate+nitrite, and 0.04 mg l-1 nitrogen as total ammonia. Seasonal variation for the majority of water quality constituents within the Athabasca tributaries can be strong and is highly reflective of hydrological discharge (i.e., highest concentrations typically occur during snowmelt periods, especially for parameters that are bound to particulate matter). Spatial variation of parameters within tributaries general showed an increasing trend from upstream of development to samples collected downstream of development (near mouth of a tributary). Of the 45 water quality constituents (physical characteristics, major ions, metals, metalloids, selenium) and 52 Polycyclic Aromatic Compounds (PACs) analyzed, 28 have Guidelines for the Protection of Aquatic Life (Canadian Council of Ministers of the Environment – CCME). Only a few parameters were classified with frequent exceedances (i.e., >10% of of the approximately 1430 samples): total iron, 99% of all samples; total aluminum, 61%; total suspended solids, 39%; and total copper, 17%. All measurements of total mercury were below the CCME guideline; only pyrene from the PACs showed occasional exceedances (2% of samples) for established guidelines. Exceedances of guidelines are not uncommon in many river systems within and outside of the Oil Sands region and, in general, are associated with high flow events when suspended solids and contaminant loads are the greatest. High concentrations of suspended sediment (measured as total suspended solids) were observed during high flow events, such as occur during snowmelt and summer rainfall events. The high percentage of exceedances for iron was expected as these waters are known to have naturally-occurring high concentrations of iron. Mercury in Tributaries This data set includes river water concentrations of total mercury (THg; all forms of mercury in a sample) and methyl mercury (MeHg; the form of mercury that bioaccumulates through food webs) in five Athabasca River tributaries (Ells, Steepbank, Firebag, Muskeg and MacKay rivers). No samples exceeded the Canadian Council of Ministers of the Environment guidelines for THg and MeHg.
-
Gridded monthly, seasonal and annual mean temperature anomalies derived from daily minimum, maximum and mean surface air temperatures (degrees Celsius) is available at a 50km resolution across Canada. The Canadian gridded data (CANGRD) are interpolated from homogenized temperature (i.e., AHCCD datasets). Homogenized temperatures incorporate adjustments to the original station data to account for discontinuities from non-climatic factors, such as instrument changes or station relocation. The anomalies are the difference between the temperature for a given year or season and a baseline value (defined as the average over 1961-1990 as the reference period). The yearly and seasonal temperature anomalies were computed for the years 1948 to 2017. The data will continue to be updated every year.
-
High-resolution statistically downscaled climate indices relevant to climate change impacts in Canada are available at a 10 km spatial resolution and an annual temporal resolution for 1951-2100. The climate indices are based on model projections from 24 global climate models (GCMs) that participated in the Coupled Model Intercomparison Project Phase 5 (CMIP5). To address the needs of different user groups in Canada, agroclimate indices and other indices that were proposed by the Canadian adaptation community through a series of consultations are provided. This range of climate indices are of relevance to adaptation planning for different sectors in Canada, such as human and ecological health, agriculture and energy. Available for download are indices that represent the counts of the number of days when temperature or precipitation exceeds (or is below) a threshold value; the lengths of episodes when a particular weather/climate condition occurs; and indices that accumulate temperature departures above or below a fixed threshold. Multi-model datasets of the statistically downscaled climate indices for historical simulations and three emission scenarios, RCP2.6, RCP4.5 and RCP8.5, are available. Both multi-model ensembles and individual model output are available for download. The fifth, 25th, 50th (median), 75th and 95th percentiles of the annual ensembles are available for each climate index, from 1951-2100. Note: Projections among climate models can vary because of differences in their underlying representation of earth system processes. Thus, the use of a multi-model ensemble approach has been demonstrated in recent scientific literature to likely provide better projected climate change information. Further, projected future changes by statistically downscaled products are not necessarily more creditable than those by the underlying climate model outputs. In many cases, especially for absolute threshold-based indices, projections based on downscaled data have smaller spread because of the removal of model biases. However, this is not the case for all indices. Downscaling from GCM resolution to the fine resolution needed for impacts assessment increases the level of spatial detail and temporal variability to better match observations. Since these adjustments are GCM dependent, the resulting indices could have wider spread when computed from downscaled data as compared to those directly computed from GCM output. In the latter case, it is not the downscaling procedure that makes future projection more uncertain; rather, it is indicative of higher variability associated with finer spatial scale.