
2015
Type of resources
Topics
Keywords
Contact for the resource
Provided by
Years
Formats
Representation types
Update frequencies
status
-
This collection houses PDFs of active BBS route maps, which are grouped by province or territory. These maps allow BBS volunteers in Canada to easily locate the start of their route, and to navigate the official route. The BBS is jointly coordinated by Environment Canada's Canadian Wildlife Service and the U.S. Geological Survey (USGS), Patuxent Wildlife Research Center. Any use of BBS data for Canada should acknowledge the hundreds of skilled volunteers in Canada who have participated in the BBS over the years, those who have served as provincial or territorial coordinators for the BBS, and the Boreal Avian Modelling Project (BAM; www.borealbirds.ca), whose collaboration was invaluable to the creation of the BBS route and stop location dataset.
-
The surveys are conducted along the sandspit and within a 96 ha lagoon that encompasses mudflats, eelgrass beds, and saltmarsh at the northwest end of Sidney Island, located in the Strait of Georgia, British Columbia. The survey counts numerate two species, Western Sandpiper (Calidris mauri) and Least Sandpiper (Calidris minutilla), during a portion of the southern migration period (July, August, and early September), and have been conducted intermittently since 1990. Sidney Island (48°37’39’N, 123°19’30”W) is located within the Salish Sea (Strait of Georgia), 4 km off the coast of Vancouver Island in southwestern British Columbia, Canada. Southbound Western and Least Sandpipers stop over within Sidney Spit Marine Park (part of the Gulf Islands National Park Reserve), roosting and feeding along the sandspit and within a 96 ha lagoon that encompasses mudflats, eelgrass beds, and saltmarsh at the northwest end of the island. These species are the most numerous shorebird species using the area during southern migration. Adults precede juveniles, arriving at the end of June and throughout July. Juveniles reach the site in early August, with their numbers trailing off in early September. As a result, the site experiences a transition from purely adult to purely juvenile flocks over the course of the season. Daily counts, beginning in early July and ending in early September, were conducted in 1990 and from 1992-2001 (no counts occurred in 1991). Effort was reduced to weekly surveys between 2002 and 2013. Over the entire monitoring period median survey effort was 9 counts annually. All counts were conducted at the low tide of the day, when shorebirds were feeding in the exposed mudflat of the lagoon. Observers walked along the shore of the lagoon stopping periodically at vantage points to look for birds. For ease of data recording and to keep track of individual flocks, the survey area was divided into separate units demarcated by prominent geographical features. Counts were made with the unaided eye, through binoculars, and with a 20 – 60x zoom spotting scope, depending on the proximity of the birds. All individuals in small flocks were counted and individuals in large flocks were estimated by counting in groups of 5, 10, 50 or 100 according to flock size in each successive field of view across a scan of the entire flock. Between 1990 and 2001, when daily counts were conducted, birds were occasionally counted more than once in a day. The largest count value obtained was used as the daily estimate for these days. For smaller flocks, we were able to identify all individual birds to species and age-class. Sub-samples from larger flocks were also aged (adult or juvenile) and identified to species. Birds were aged by plumage characteristics. Adult Western Sandpipers are distinguished from juveniles by the dark chevron markings present along the sides and breast. Juvenile Least Sandpipers have a buffy breast compared to the distinct, darker one of the adult, and juveniles have bright rufous scapulars compared to the drab feather-edges of the adults. In both species, juvenile plumage appears brighter and cleaner than adult plumage, which is more worn and tattered.
-
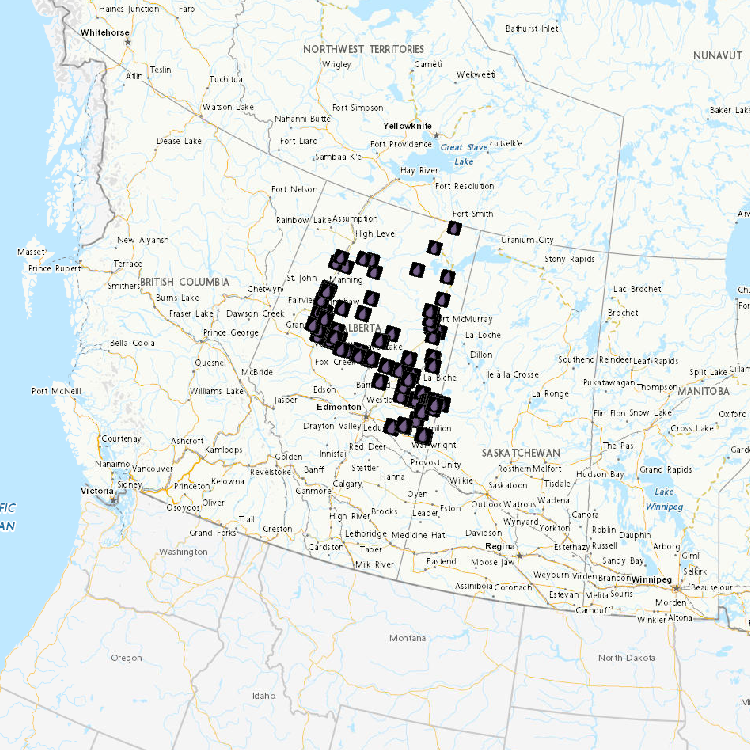
The river bed sediments in the Lower Athabasca are known to shift and migrate downstream. Numerical modelling of water quantity and quality (including sediments) requires accurate river channel cross-sectional geometry within the area of study. Such cross-sectional geometry prior to 2012 was limited for the Lower Athabasca River restricting modelling accuracy and efficiency. As such, in order to better understand the bed sediment dynamics of the lower Athabasca River and to support model development (e.g., calibration/validation of sediment/bitumen erosion/transport/deposition), high resolution swath bathymetry data were collected form bank to bank during open water seasons (2012-2014) covering approximately 115 km from Fort McMurray to the mouth of the Firebag River. Data are presented in 2km stretches of the river and are represented by 1) a kmz file which gives a visual representation of the coverage of the file, and 2) a detailed grid file which contains the full x,y,z coordinates at 0.5m resolution. While very useful for modelling, it should be realized that given the continually changing form of the lower Athabasca bed geometry, the data provided is a “snap shot in time” and is not reflective of the current condition. Further, and as related, this information is not for navigation purposes.
-
Assess the importance of atmospheric deposition of contaminants as a contributor to ecological impacts of oil sands development and identify sources. • Use snowpack measurements sampled across a gridwork to develop maps of winter-time atmospheric contaminant loadings for the region ~100 km from the major upgrading facilities • Assess long-term trends in winter-time atmospheric deposition • Determine the potential impact of wintertime snowpack mercury loads on tributary river water mercury concentrations (Spring Freshet) using Geographic Information System and hydrological modelling approaches • Compare snowpack loadings to those obtained from precipitation monitoring and compare spatial patterns to PAC air measurements obtained from passive sampling network
-
This dataset contains blended (gauge and satellite estimates) pentad mean precipitation rates (unit: mm/day) at a one degree spatial resolution over Canada. The data can be used for hydrometeorological, agricultural, forestry modelling, for numerical weather model and climate model verification, and for climate impact studies.
-
Water level and discharge data are available from Water Survey of Canada’s Hydrometric Network. The Water Survey of Canada (WSC) is the national authority responsible for the collection, interpretation and dissemination of standardized water resource data and information in Canada. In partnership with the provinces, territories and other agencies, WSC operates over 2500 active hydrometric gauges across the country, maintains an archive of historical information for over 7600 stations and provides access to near real-time (water level and stream flow) provisional data at over 1700 locations in Canada.
-
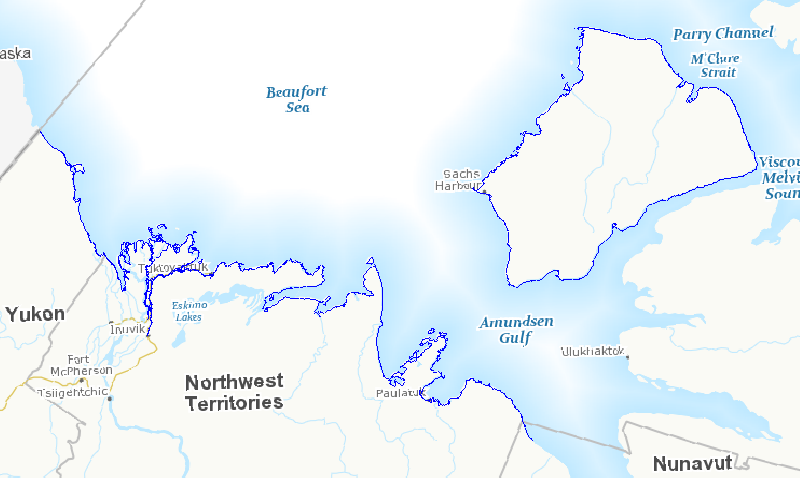
In the face of increasing economic opportunities in Canada's northern regions, the need to improve our state of preparedness for oil spill related emergencies in particular is critical. While significant efforts have been put towards documenting baseline coastal information across Canada’s southern regions, there is a large information gap regarding Arctic shorelines. Baseline coastal information such as shoreline form, substrate and vegetation type, is required for operational prioritization, coordination of on-site spill response activities (i.e., SCAT: Shoreline Cleanup and Assessment Technique), as well as providing valuable information for wildlife and ecosystem management. A standardized methodology was developed to map shoreline characteristics at six study sites across the Canadian Arctic: James Bay, Resolute Bay, Hudson Bay, Labrador Coast, Victoria Strait, and Beaufort Sea. Geo-referenced high definition videography was collected during the summers of 2010 to 2012 along coastlines within the study sites. Detailed information (i.e. shoreline type, substrate, form, height, slope, fetch, access type, exposure, etc.) describing the upper intertidal, supratidal, and backshore zones was extracted from the video and entered into a geospatial database using a data collection form. This information was used to delimit and map alongshore segments in the upper intertidal zone. The result is a vector dataset containing thousands of linear shoreline segments ranging in length from 200 m and 2 km long. In total, almost seven thousand kilometers of northern shorelines were mapped, including twenty five different shoreline types based on the upper intertidal zone. This information will feed into a larger ongoing project focused on Arctic coastal ecosystems as well as serve as valuable information for oil spill response planning should the need arise. This database also provides valuable information for habitat management, local shoreline planning, can feed into environmental assessments or be used to aid research site selection.
-
The North American Breeding Bird Survey (BBS) is a road-based, long-term, continental survey that focuses on measuring breeding bird abundance at 50 stops along roughly 40-km long transects. This collection houses PDFs of active BBS route maps, which are grouped by province or territory. These maps allow BBS volunteers in Canada to easily locate the start of their route, and to navigate the official route. Once available, the collection will also house the GIS shapefiles for all active and discontinued route paths in Canada, and the current locations for all 50 stops along each transect. This collection also houses archived trend results and annual indices derived from analyses prepared by the Canadian Wildlife Service using BBS data for 2009, 2011 and 2012. A link for the most current BBS trend results is provided below under Supplemental Information. Raw BBS data are publicly available through through the USGS Patuxent Wildlife Research Center's website, at the link provided below under Supplemental Information. The BBS is jointly coordinated by Environment Canada's Canadian Wildlife Service and the U.S. Geological Survey (USGS), Patuxent Wildlife Research Center. Any use of BBS data for Canada should acknowledge the hundreds of skilled volunteers in Canada who have participated in the BBS over the years, those who have served as provincial or territorial coordinators for the BBS, and the Boreal Avian Modelling Project (BAM; www.borealbirds.ca), whose collaboration was invaluable to the creation of the BBS route and stop location dataset.
-
Fish Status and Ecosystem Health - Caged Invertebrates In situ exposures of Hyalella azteca in Athabasca River tributaries - Summary of activities (2010, 2012, 2013, 2014) In situ exposures with Hyalella azteca were conducted within the oil sands region to assess differences in survival and growth of invertebrates caged at natural sites (i.e., exposed to naturally occurring sources of bitumen) compared to sites influenced by oil sands mining activity (i.e., exposed to both naturally occurring and anthropogenic sources of bitumen).Hyalella were collected from a wetland within the Athabasca River watershed but outside the area of oil sands development and activity. They were then placed in cages submerged at 3 sites on the Ells River, 3 sites on the Firebag River, and 4 sites on the Steepbank River. Five cages were deployed per site, each cage containing 20 Hyalella. Cages were removed two weeks after deployment, and Hyalella were counted and weighed as a group to determine growth. The data show no differences in survival or growth of Hyalella caged in situ at any of the 10 sites, when comparing natural sites to sites influenced by oil sands mining activity within each river (i.e., upstream to downstream sites) or between rivers. Caged Mussels Mature mussels (Pyganodon grandis) were collected from a site outside the oil development area (Clearwater River and Long Lake, Alberta) and placed into cages at various sites in the Athabasca River and tributaries for 4 to 6 weeks during the months of August, September and October 2012, 2013 and 2014. The data revealed that mussel growth and survival rates were not affected. Mussels exposed to river water for 4 to 6 weeks were less likely to survive when kept outside of the water for long periods of time (days). Further investigations are warranted to confirm these observations.
-
These data are associated with the following two publications: Zhiyong Wu, Staebler R., Vet R., and Zhang L. (2016), Dry deposition of O3 and SO2 estimated from gradient measurements above a temperate mixed forest. Environmental Pollution, 210, 202-210, DOI: 10.1016/j.envpol.2015.11.052 and Zhiyong Wu, Schwede D., Vet R., Walker J.T., Shaw M., Staebler R., and Zhang L. (2018), Evaluation and Intercomparison of five dry deposition algorithms in North America. Journal of Advances in Modeling Earth Systems. The files contains hourly measurement-based and model-based dry deposition velocities (Vd in cm/s) for ozone (O3) and sulphur dioxide (SO2) over a temperate mixed forest site located near Borden, Ontario, Canada from May 2008 to April 2013. The measurement-based deposition velocities were calculated from concentration gradient measurements as described in Wu et al. 2016. The model-based values are from five different inferential dry deposition velocity models described in Wu et al. (2018).