
biota
Type of resources
Topics
Keywords
Contact for the resource
Provided by
Years
Formats
Representation types
Update frequencies
status
-
The Canadian Breeding Bird Census (BBC) Database contains data for 928 breeding bird plot censuses representing all known censuses of breeding birds carried out in Canada during the period 1929–1993. The 928 records in the database represent 640 unique census plots located in all provinces and territories, except Prince Edward Island. The BBC, which was replaced by the current Breeding Bird Survey, is one of the longest-running surveys of bird populations in North America, and was designed to help determine abundance and distribution patterns of bird species. An important feature of the BBC Database is the habitat data associated with each census plot. The most prevalent vegetation species in different layers (canopy, shrub and ground cover) were recorded to reflect the assumption that birds respond principally to vegetative structure.
-
Attribute data table which contains survey effort values for each season, total bird density, species richness value, species at risk score, and grid cell importance score.
-
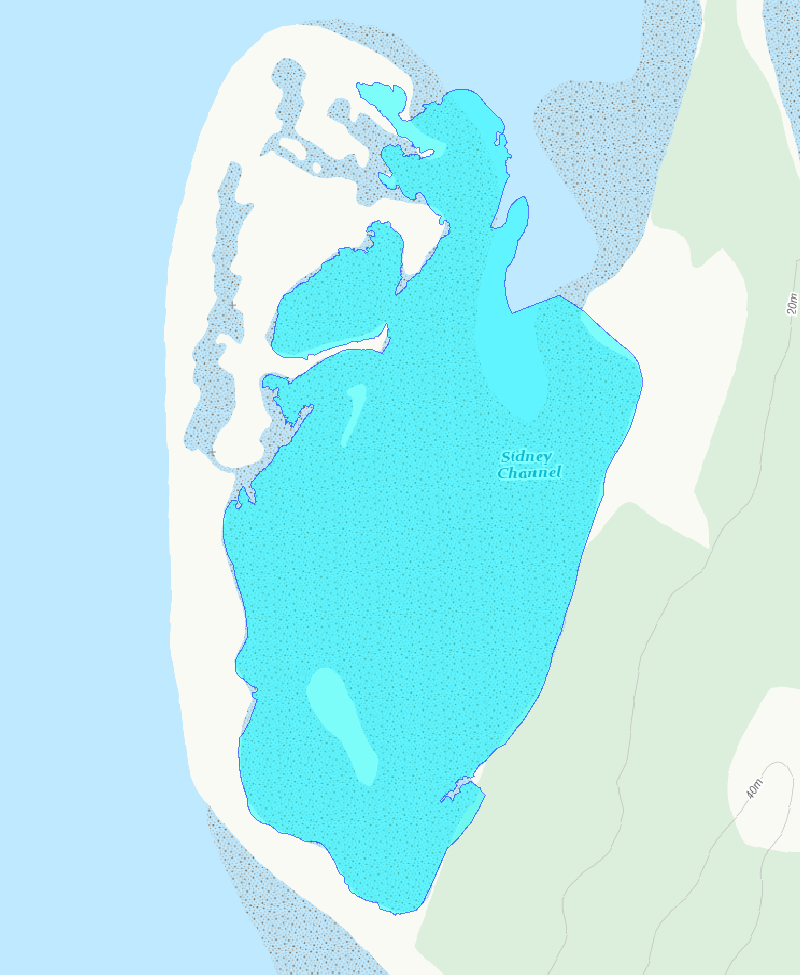
Sidney Island Shorebird Surveys transects area feature.
-
Surveyor shorebird bird observations and counts for all years.
-
Monitor variations in seabird numbers and colony size in the St. Lawrence system. Survey of over 20 species of seabirds and herons during the breeding season, in order to monitor population dynamics through time and space. Seabird populations are influenced by food abundance and quality. There is actually more than 1,000,000 birds from more than 20 different species that breed in nearly 1,000 active colonies. Plongeon du Pacifique/Pacific Loon/Gavia Pacifica, Plongeon catmarin/Red-throated Loon/Gavia stellata, Macareux moine/Atlantic Puffin/Fratercula arctica, Guillemot à miroir/Black Guillemot/Cepphus grylle, Guillemot marmette/Common Murre/Uria aalge, Guillemot de Brünnich/Thick-billed Murre/Uria lomvia, Petit Pingouin/Razorbill/Alca torda, Mouette tridactyle/Black-legged Kittiwake/Rissa tridactyla, Goéland marin/Great Black-backed Gull/Larus marinus, Goéland argenté/Herring Gull/Larus argentatus, Goéland à bec cerclé/Ring-billed Gull/Larus delawarensis, Mouette rieuse/Common Black-headed Gull/Larus ridibundus, Sterne caspienne/Caspian Tern/Sterna caspia, Sterne pierregarin/Common Tern/Sterna hirundo, Sterne arctique/ArcticTern/Sterna paradisaea, Sterne de Dougall/Roseate Tern/Sterna dougallii, Océanite cul-blanc/Leach's Storm-Petrel/Oceanodroma leucorhoa, Fou de Bassan/Northern Gannet/Morus bassanus, Grand Cormoran/Great Cormorant/Phalacrocorax carbo, Cormoran à aigrettes/Double-crested Cormorant/Phalacrocorax auritus, Eider à duvet/Common Eider/Somateria mollissima, Grand Héron/Great Blue Heron/Ardea herodias, Bihoreau gris/Black-crowned Night-Heron/Nycticorax nycticorax.
-
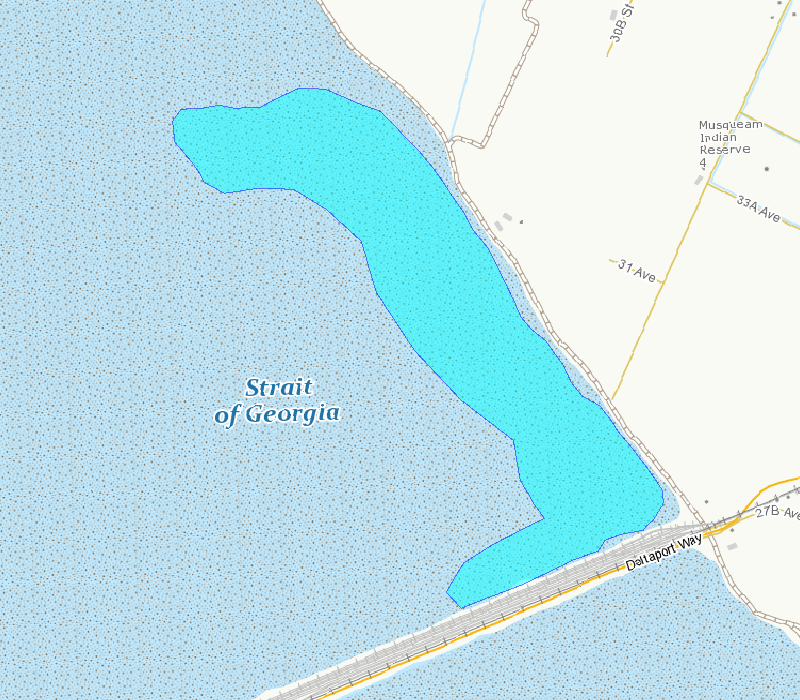
This polygon outlines the basic area included in the survey counts. This area is the best approximation of the mudflat that can be surveyed from shore and is exposed at tide tide height of 3.5 m, based on tidal predictions at Point Atkinson, British Columbia.
-
These surveys focus on two abundant shorebird species, Western Sandpiper (Calidris mauri) and Dunlin (Calidris alpina), and are conducted at a large mudflat on Roberts Bank, Delta, British Columbia, approximately 35 km south of Vancouver. These survey counts began in 1991 and are conducted annually during the northern migration period (April and May). Species-specific counts are derived from total flock counts multiplied by an estimate of percentage composition of the two species. The Brunswick Point study site (49°03′ N, 123°09′ W) extends over the southern third of Roberts Bank, and encompasses a large mudflat (tidal range = 0 – 3.8 m) separated from agricultural fields by a dike. Vegetation in the near shore sections of the mudflat is composed mostly of saltmarsh and bushes. Sediments in the mudflat range from soft mud to sand, and portions of the lower intertidal zone are covered with eelgrass (Zostera marina and Z. japonica). A causeway supporting a major port facility separates the mudflat from the remainder of Roberts Bank, and the dike is used for recreational purposes. Total flock counts. The number of total flock counts conducted annually varied from seven to 15 counts from 1991 to 1998. Beginning in 1999, counts were conducted either daily or every other day during spring migration for an annual replicate of 17 32 counts. The migration period began on 15 April each year and continued until lesser than 1000 birds were observed or until 15 May, whichever came first. This timing was chosen to overlap with the major pulse of Western Sandpiper migration and also captured peak Dunlin numbers. Daily timing of surveys depended on the tide cycle; the start of surveys ranged between 05:45 and 19:00 hr. Counts were conducted at a tide height of 3.5 m, based on tidal predictions at Point Atkinson, British Columbia. This tide height ensured birds were close to shore, with sufficient mudflat exposed to present good feeding opportunities for shorebirds. Occasionally maximum daily tide heights did not reach 3.5 m, and counts on these days were conducted during the actual maximum tide heights. Counts began at the southern end of the Brunswick Point dike where it meets the Roberts Bank Superport causeway. All birds visible on the mudflat were counted from a vehicle along a series of stops on the dike, for a total length of ~2.5 km. Birds were counted through a spotting scope mounted on the vehicle window, primarily for distant flocks, and through binoculars to count birds near the vehicle. Flocks were counted by an initial assessment of flock density, and then by counting blocks incrementally in 50s, 100s, 500s, or 1000s, according to flock size, in each successive field of view across a scan of the entire flock. In 1992, the number of birds in large flocks was estimated by multiplying the number of square metres of mudflat covered by the flock by the average number of sandpipers in several 1-m2 plots estimated by eye (Butler 1994). Species composition: Only total flock counts were conducted prior to 1997, as deriving species-specific counts was complicated by the intermixing of Western Sandpipers and Dunlin in the large flocks. Species-specific counts are calculated as a product of total flock counts and percentage composition of different species. From 1997 onwards, relative species composition (ratio of Western Sandpipers to Dunlins) was estimated during supplementary counts as birds settled on the mudflats before or after the main shorebird counts described above. Numbers of Western Sandpipers and Dunlins were individually tallied along visually estimated 1 m wide strips that ran perpendicular from the dike to the water’s edge, and included both open mudflat and shallow water. Tallies of all strip counts were summed and the species proportion for that day was calculated as the number of each species counted divided by the total number of birds.
-
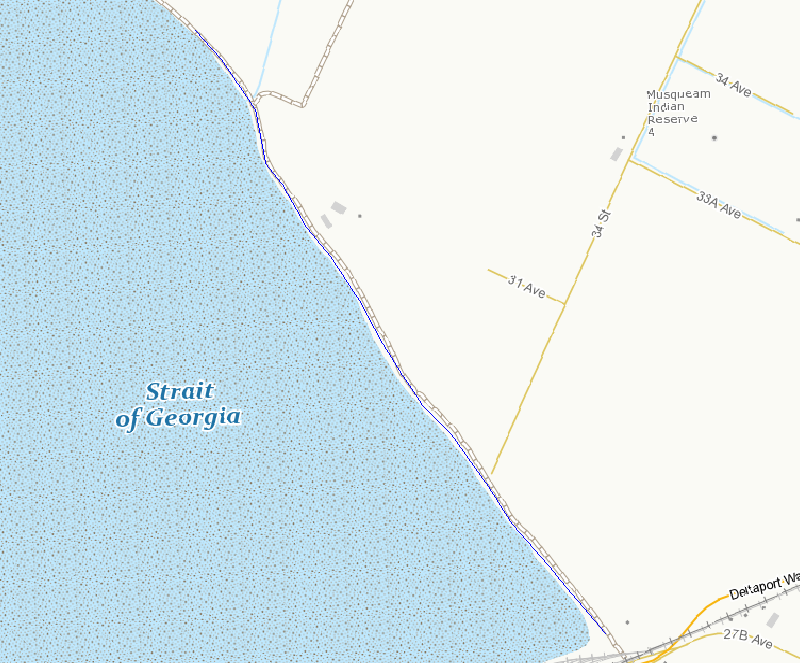
This line outlines the basic survey route included in the survey counts. This route is the best access to areas that can be surveyed from shore.
-
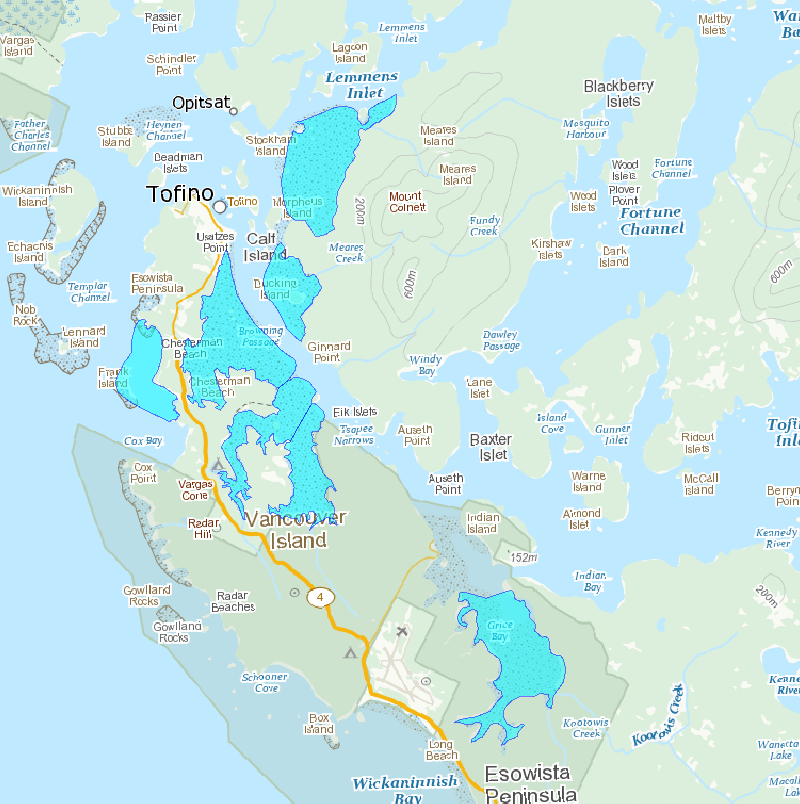
Survey areas is a polygon feature class containing mudflats and staging areas observed for shorebirds.
-
The surveys are conducted along the sandspit and within a 96 ha lagoon that encompasses mudflats, eelgrass beds, and saltmarsh at the northwest end of Sidney Island, located in the Strait of Georgia, British Columbia. The survey counts numerate two species, Western Sandpiper (Calidris mauri) and Least Sandpiper (Calidris minutilla), during a portion of the southern migration period (July, August, and early September), and have been conducted intermittently since 1990. Sidney Island (48°37’39’N, 123°19’30”W) is located within the Salish Sea (Strait of Georgia), 4 km off the coast of Vancouver Island in southwestern British Columbia, Canada. Southbound Western and Least Sandpipers stop over within Sidney Spit Marine Park (part of the Gulf Islands National Park Reserve), roosting and feeding along the sandspit and within a 96 ha lagoon that encompasses mudflats, eelgrass beds, and saltmarsh at the northwest end of the island. These species are the most numerous shorebird species using the area during southern migration. Adults precede juveniles, arriving at the end of June and throughout July. Juveniles reach the site in early August, with their numbers trailing off in early September. As a result, the site experiences a transition from purely adult to purely juvenile flocks over the course of the season. Daily counts, beginning in early July and ending in early September, were conducted in 1990 and from 1992-2001 (no counts occurred in 1991). Effort was reduced to weekly surveys between 2002 and 2013. Over the entire monitoring period median survey effort was 9 counts annually. All counts were conducted at the low tide of the day, when shorebirds were feeding in the exposed mudflat of the lagoon. Observers walked along the shore of the lagoon stopping periodically at vantage points to look for birds. For ease of data recording and to keep track of individual flocks, the survey area was divided into separate units demarcated by prominent geographical features. Counts were made with the unaided eye, through binoculars, and with a 20 – 60x zoom spotting scope, depending on the proximity of the birds. All individuals in small flocks were counted and individuals in large flocks were estimated by counting in groups of 5, 10, 50 or 100 according to flock size in each successive field of view across a scan of the entire flock. Between 1990 and 2001, when daily counts were conducted, birds were occasionally counted more than once in a day. The largest count value obtained was used as the daily estimate for these days. For smaller flocks, we were able to identify all individual birds to species and age-class. Sub-samples from larger flocks were also aged (adult or juvenile) and identified to species. Birds were aged by plumage characteristics. Adult Western Sandpipers are distinguished from juveniles by the dark chevron markings present along the sides and breast. Juvenile Least Sandpipers have a buffy breast compared to the distinct, darker one of the adult, and juveniles have bright rufous scapulars compared to the drab feather-edges of the adults. In both species, juvenile plumage appears brighter and cleaner than adult plumage, which is more worn and tattered.