
inlandWaters
Type of resources
Topics
Keywords
Contact for the resource
Provided by
Years
Formats
Representation types
Update frequencies
status
-
The Canadian Aquatic Biomonitoring Network (CABIN) is an aquatic biomonitoring program for assessing the health of fresh water ecosystems in Canada. Benthic macroinvertebrates are collected at a site location and their counts are used as an indicator of the health of that water body. CABIN is based on the network of networks approach that promotes inter-agency collaboration and data-sharing to achieve consistent and comparable reporting on fresh water quality and aquatic ecosystem conditions in Canada. The program is maintained by Environment and Climate Change Canada (ECCC) to support the collection, assessment, reporting and distribution of biological monitoring information. A set of nationally standardized CABIN protocols are used for field collection, laboratory work, and analysis of biological monitoring data. A training program is available to certify participants in the standard protocols. There are two types of sites in the CABIN database (reference and test). Reference sites represent habitats that are closest to “natural” before any human impact. The data from reference sites are used to create reference models that CABIN partners use to evaluate their test sites in an approach known as the Reference Condition Approach (RCA). Using the RCA models, CABIN partners match their test sites to groups of reference sites on similar habitats and compare the observed macroinvertebrate communities. The extent of the differences between the test site communities and the reference site communities allows CABIN partners to estimate the severity of the impacts at those locations. CABIN samples have been collected since 1987 and are organized in the database by study (partner project). The data is delineated by the 11 major drainage areas (MDA) found in Canada and each one has a corresponding study, habitat and benthic invertebrate data file. Links to auxiliary water quality data are provided when available. Visits may be conducted at the same location over time with repeat site visits being identified by identical study name / site code with different dates. All data collected by the federal government is available on Open Data and more partners are adding their data continually. The csv files are updated monthly. Contact the CABIN study authority to request permission to access non open data.
-
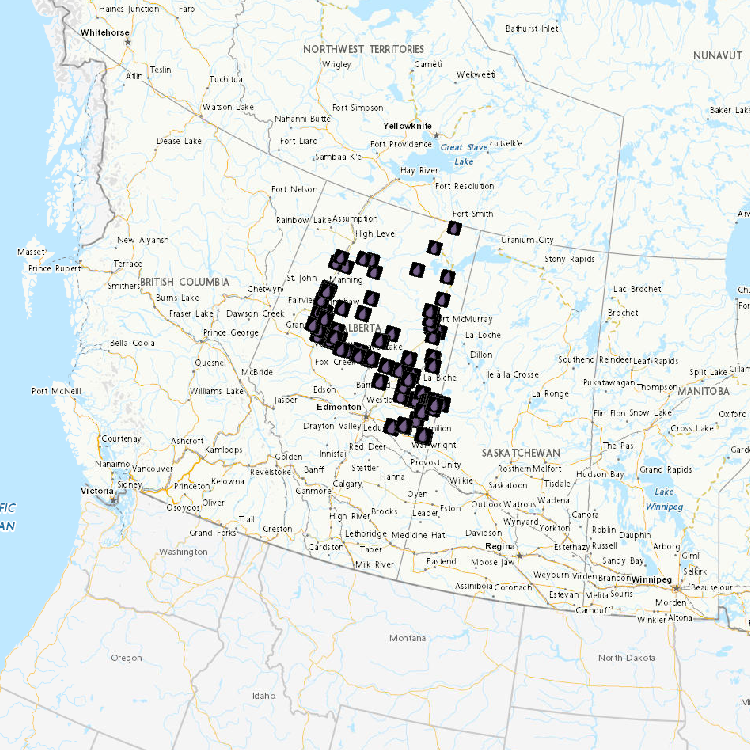
As part of a three year study funded by Environment and Climate Change Canada and Natural Resources Canada (ecoENERGY Innovation Initiative, project UOSGQ963; http://www.nrcan.gc.ca/energy/funding/current-fundingprograms/eii/4985) data were gathered to assess and monitor water quality conditions in northeastern British Columbia (BC). Defined in this datasetas portions of the Petitot, Fort Nelson, and Hay River basins, northeast BC is a region subject to both historical conventional oil and gas development and more recent unconventional oil and gas (UOG) development. UOG development in this area is presently focused on the Horn River Basin, Cordova Embayment and Liard Basin shale formations (BCOGC 2010, 2013a). Otherwise, UOG development in BC is centered in the Montney Play, located further south (Adams et al. 2016). Surface water quality assessment and monitoring focused on two river basins in this area: the Petitot River Basin and the Fort Nelson River Basin. Baseline and/or best available surface water quality information was gathered from January 2012 to March 2015. Benthic macroinvertebrates were collected over the same period to complement the water quality study through development of a Canadian Aquatic Biomonitoring Network (CABIN) bioassessment model. Routine Water Quality Monitoring study objectives were to gain a better understanding of water quality conditions in the Petitot River Basin by collecting baseline data using a standard suite of physical-chemical variables and establishing a representative long-term site. Routine water quality sampling sites were selected at locations with known exposure to UOG activity and varying watershed areas; submersible loggers were also installed to collect specific conductance and temperature data. Synoptic Water Quality Monitoring study objectives were to establish patterns of spatial and temporal water chemistry through synoptic water sampling at high and low flow periods and examine potential relationships between UOG activity and surface water quality. Sample sites were selected at microbasin drainage outlets to represent a range of upstream activity and potential contamination. A series of samples were also collected along the mainstem Petitot River at 20-kilometre intervals from the Alberta border to the Highway 77 bridge to capture potential “step-changes” in water chemistry as the river flows through the northeast BC gas production area. Biological Monitoring study objectives were to establish baseline reference conditions based on benthic macroinvertebrate communities and habitat characteristics, and develop a predictive bioassessment model to assess the ecosystem health of streams in the Liard, Fort Nelson, and Petitot River basins exposed to UOG activity. The biological monitoring study design followed CABIN sampling methodology for benthic macroinvertebrate collections in streams and rivers (Environment Canada 2012, http://www.ec.gc.ca/rcba-cabin). Sampling was conducted at 53 reference sites unaffected or minimally influenced by human activity. Thirty five test sites were also selected across a gradient of UOG activity, based on well densities. A preliminary predictive bioassessment model for northeast BC was established and is available through the CABIN website for future assessment of water quality and ecosystem health in the region.
-
Long-term freshwater quality monitoring data for Rainy River / Lake of the Woods Watershed for the past 15 years or longer for nutrients, metals, major ions, and other physical-chemical variables are included in this dataset. Monitoring is conducted by Environment and Climate Change Canada (ECCC) to assess water quality status and long-term trends, detect emerging issues, establish water quality guidelines and track the effectiveness of remedial measures and regulatory decisions. The information informs and supports the Fresh Water Action Plan.
-
Observations on various types of wetlands, terrestrial environments, and vascular plants for 102 sites visited in 2012 and located on Lake Saint-Pierre are included in this dataset. Since the 1970s, Environment and Climate change Canada (ECCC) has been monitoring changes in wetlands under the State of the St. Lawrence River Monitoring program of the St. Lawrence Action Plan.
-
Observations on various types of wetlands, terrestrial environments, and vascular plants for 55 sites visited in 2012 and located in in the Boucherville Islands are included in this dataset. Since the 1970s, Environment and Climate Change Canada (ECCC) has been monitoring changes in wetlands under the State of the St. Lawrence River Monitoring program of the St. Lawrence Action Plan.
-
The river bed sediments in the Lower Athabasca are known to shift and migrate downstream. Numerical modelling of water quantity and quality (including sediments) requires accurate river channel cross-sectional geometry within the area of study. Such cross-sectional geometry prior to 2012 was limited for the Lower Athabasca River restricting modelling accuracy and efficiency. As such, in order to better understand the bed sediment dynamics of the lower Athabasca River and to support model development (e.g., calibration/validation of sediment/bitumen erosion/transport/deposition), high resolution swath bathymetry data were collected form bank to bank during open water seasons (2012-2014) covering approximately 115 km from Fort McMurray to the mouth of the Firebag River. Data are presented in 2km stretches of the river and are represented by 1) a kmz file which gives a visual representation of the coverage of the file, and 2) a detailed grid file which contains the full x,y,z coordinates at 0.5m resolution. While very useful for modelling, it should be realized that given the continually changing form of the lower Athabasca bed geometry, the data provided is a “snap shot in time” and is not reflective of the current condition. Further, and as related, this information is not for navigation purposes.
-
Water Quality Monitoring on Tributaries in the Athabasca River Oil Sands Region Ells River (EL1, ELLS RIFF 2, ELLS RIFF5 [2012-2015]) Mackay River (MA1 [2012-2015], MA2 [2013-2015]) Steepbank River (STB RIFF1, STB WSC, STB RIFF7, STB RIFF10 [2012-2015]) Firebag River (FI1, FI WSC [2012-2015]) Muskeg River (MU1 [2012-2015]), MU6 [2012-2015]), MU7 [2012]) High Hills River (HIHI1 [2013-2015]) Water quality of tributaries in the Athabasca River oil sands region is heavily influenced by the presence of the underlying Cretaceous bedrock, which is comprised of shale, sandstone and limestone. The waters are moderately hard (average alkalinity of 114 mg l-1 CaCO3) because of their mineral content, particularly magnesium (average 8.62 mg l-1), calcium (average 28.06 mg l-1) and bicarbonate (138.53 mg l-1). This mineral content results in an average conductivity of 245 +/- 4 µS cm-1 and total dissolved solids concentration of 140 +/- 2 ppm. Concentrations of nitrogen and phosphorus (indicators of nutrient status) are typically low to moderate, averaging 0.14 mg l-1 total phosphorus, 0.03 mg l-1 total dissolved phosphorus, 0.92 mg l-1 total nitrogen, 0.09 mg l-1 nitrogen as nitrate+nitrite, and 0.04 mg l-1 nitrogen as total ammonia. Seasonal variation for the majority of water quality constituents within the Athabasca tributaries can be strong and is highly reflective of hydrological discharge (i.e., highest concentrations typically occur during snowmelt periods, especially for parameters that are bound to particulate matter). Spatial variation of parameters within tributaries general showed an increasing trend from upstream of development to samples collected downstream of development (near mouth of a tributary). Of the 45 water quality constituents (physical characteristics, major ions, metals, metalloids, selenium) and 52 Polycyclic Aromatic Compounds (PACs) analyzed, 28 have Guidelines for the Protection of Aquatic Life (Canadian Council of Ministers of the Environment – CCME). Only a few parameters were classified with frequent exceedances (i.e., >10% of of the approximately 1430 samples): total iron, 99% of all samples; total aluminum, 61%; total suspended solids, 39%; and total copper, 17%. All measurements of total mercury were below the CCME guideline; only pyrene from the PACs showed occasional exceedances (2% of samples) for established guidelines. Exceedances of guidelines are not uncommon in many river systems within and outside of the Oil Sands region and, in general, are associated with high flow events when suspended solids and contaminant loads are the greatest. High concentrations of suspended sediment (measured as total suspended solids) were observed during high flow events, such as occur during snowmelt and summer rainfall events. The high percentage of exceedances for iron was expected as these waters are known to have naturally-occurring high concentrations of iron. Mercury in Tributaries This data set includes river water concentrations of total mercury (THg; all forms of mercury in a sample) and methyl mercury (MeHg; the form of mercury that bioaccumulates through food webs) in five Athabasca River tributaries (Ells, Steepbank, Firebag, Muskeg and MacKay rivers). No samples exceeded the Canadian Council of Ministers of the Environment guidelines for THg and MeHg.
-
Water level and discharge data are available from Water Survey of Canada’s Hydrometric Network. The Water Survey of Canada (WSC) is the national authority responsible for the collection, interpretation and dissemination of standardized water resource data and information in Canada. In partnership with the provinces, territories and other agencies, WSC operates over 2500 active hydrometric gauges across the country, maintains an archive of historical information for over 7600 stations and provides access to near real-time (water level and stream flow) provisional data at over 1700 locations in Canada.
-
Long-term freshwater quality monitoring data for over five sites in the Peace - Athabasca River Basin for the past 15 years or longer for nutrients, metals, major ions, and other physical-chemical variables are included in this dataset. Monitoring is conducted by Environment and Climate Change Canada (ECCC) as well as through the Joint Oil Sands Monitoring Program, or in collaboration with Parks Canada and the Northwest Territories to assess water quality status and long-term trends, detect emerging issues, establish water quality guidelines and track the effectiveness of remedial measures and regulatory decisions.
-
Long-term freshwater quality monitoring data for over 14 sites in the Fraser River Basin for the past 15 years or longer for nutrients, metals, major ions, and other physical-chemical variables are included in this dataset. Monitoring is conducted by Environment and Climate Change Canada (ECCC) and under the Canada-British Columbia Water Quality Monitoring Agreement to assess water quality status and long-term trends, detect emerging issues, establish water quality guidelines and track the effectiveness of remedial measures and regulatory decisions.