
2019
Type of resources
Topics
Keywords
Contact for the resource
Provided by
Years
Formats
Representation types
Update frequencies
status
-
The data consists of temperature indices based on homogenized daily maximum and minimum temperatures at 338 locations across Canada, and of precipitation indices based on adjusted daily rainfall, daily snowfall and daily precipitation amounts at 463 locations across the country. These indices were selected for their relevance to social and economic impact assessment in Canada and for the insights they could provide regarding changes in extreme climate conditions. Please refer to the papers below for detailed information regarding the adjustment procedures and the trends in the indices.
-

This dataset provides geospatial polygon boundaries for marine bivalve shellfish harvest area classification in British Columbia, Canada. These data represent the five classification categories of marine bivalve shellfish harvest areas (Approved; Conditionally Approved; Restricted; Conditionally Restricted; and Prohibited) under the Canadian Shellfish Sanitation Program (CSSP). Data are collected by Environment and Climate Change Canada (ECCC) for the purpose of making applicable classification recommendations on the basis of sanitary and water quality survey results. ECCC recommendations are reviewed and adopted by Regional Interdepartmental Shellfish Committees prior to regulatory implementation by Fisheries and Oceans Canada (DFO). These geographic data are for illustrative purposes only; they show shellfish harvest area classifications when in Open Status. The classification may be superseded at any time by regulatory orders issued by DFO, which place areas in Closed Status, due to conditions such as sewage overflows or elevated biotoxin levels. For further information about the current status and boundary coordinates for areas under Prohibition Order, please contact your local DFO office.
-

This dataset provides geospatial polygon boundaries for marine bivalve shellfish harvest area classification in New Brunswick, Canada. These data represent the five classification categories of marine bivalve shellfish harvest areas (Approved; Conditionally Approved; Restricted; Conditionally Restricted; and Prohibited) under the Canadian Shellfish Sanitation Program (CSSP). Data are collected by Environment and Climate Change Canada (ECCC) for the purpose of making applicable classification recommendations on the basis of sanitary and water quality survey results. ECCC recommendations are reviewed and adopted by Regional Interdepartmental Shellfish Committees prior to regulatory implementation by Fisheries and Oceans Canada (DFO). These geographic data are for illustrative purposes only; they show shellfish harvest area classifications when in Open Status. The classification may be superseded at any time by regulatory orders issued by DFO, which place areas in Closed Status, due to conditions such as sewage overflows or elevated biotoxin levels. For further information about the current status and boundary coordinates for areas under Prohibition Order, please contact your local DFO office.
-

This dataset provides geospatial polygon boundaries for marine bivalve shellfish harvest area classification in Newfoundland and Labrador, Canada. These data represent the five classification categories of marine bivalve shellfish harvest areas (Approved; Conditionally Approved; Restricted; Conditionally Restricted; and Prohibited) under the Canadian Shellfish Sanitation Program (CSSP). Data are collected by Environment and Climate Change Canada (ECCC) for the purpose of making applicable classification recommendations on the basis of sanitary and water quality survey results. ECCC recommendations are reviewed and adopted by Regional Interdepartmental Shellfish Committees prior to regulatory implementation by Fisheries and Oceans Canada (DFO). These geographic data are for illustrative purposes only; they show shellfish harvest area classifications when in Open Status. The classification may be superseded at any time by regulatory orders issued by DFO, which place areas in Closed Status, due to conditions such as sewage overflows or elevated biotoxin levels. For further information about the current status and boundary coordinates for areas under Prohibition Order, please contact your local DFO office.
-

This dataset provides geospatial polygon boundaries for marine bivalve shellfish harvest area classification in Canada (British Columbia, New Brunswick, Newfoundland and Labrador, Nova Scotia, Prince Edward Island and Quebec). These data represent the five classification categories of marine bivalve shellfish harvest areas (Approved; Conditionally Approved; Restricted; Conditionally Restricted; and Prohibited) under the Canadian Shellfish Sanitation Program (CSSP). Data are collected by Environment and Climate Change Canada (ECCC) for the purpose of making applicable classification recommendations on the basis of sanitary and water quality survey results. ECCC recommendations are reviewed and adopted by Regional Interdepartmental Shellfish Committees prior to regulatory implementation by Fisheries and Oceans Canada (DFO). These geographic data are for illustrative purposes only; they show shellfish harvest area classifications when in Open Status. The classification may be superseded at any time by regulatory orders issued by DFO, which place areas in Closed Status, due to conditions such as sewage overflows or elevated biotoxin levels. For further information about the current status and boundary coordinates for areas under Prohibition Order, please contact your local DFO office.
-

This dataset provides geospatial polygon boundaries for marine bivalve shellfish harvest area classification in Nova Scotia, Canada. These data represent the five classification categories of marine bivalve shellfish harvest areas (Approved; Conditionally Approved; Restricted; Conditionally Restricted; and Prohibited) under the Canadian Shellfish Sanitation Program (CSSP). Data are collected by Environment and Climate Change Canada (ECCC) for the purpose of making applicable classification recommendations on the basis of sanitary and water quality survey results. ECCC recommendations are reviewed and adopted by Regional Interdepartmental Shellfish Committees prior to regulatory implementation by Fisheries and Oceans Canada (DFO). These geographic data are for illustrative purposes only; they show shellfish harvest area classifications when in Open Status. The classification may be superseded at any time by regulatory orders issued by DFO, which place areas in Closed Status, due to conditions such as sewage overflows or elevated biotoxin levels. For further information about the current status and boundary coordinates for areas under Prohibition Order, please contact your local DFO office.
-

This dataset provides geospatial polygon boundaries for marine bivalve shellfish harvest area classification in Prince Edward Island, Canada. These data represent the five classification categories of marine bivalve shellfish harvest areas (Approved; Conditionally Approved; Restricted; Conditionally Restricted; and Prohibited) under the Canadian Shellfish Sanitation Program (CSSP). Data are collected by Environment and Climate Change Canada (ECCC) for the purpose of making applicable classification recommendations on the basis of sanitary and water quality survey results. ECCC recommendations are reviewed and adopted by Regional Interdepartmental Shellfish Committees prior to regulatory implementation by Fisheries and Oceans Canada (DFO). These geographic data are for illustrative purposes only; they show shellfish harvest area classifications when in Open Status. The classification may be superseded at any time by regulatory orders issued by DFO, which place areas in Closed Status, due to conditions such as sewage overflows or elevated biotoxin levels. For further information about the current status and boundary coordinates for areas under Prohibition Order, please contact your local DFO office.
-
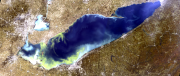
This dataset contains lake-wide algal bloom indices (extent, intensity, and severity) of Lake Erie on a daily basis over the June through October monitoring season. These data are derived from satellite remote sensing algorithms using European Space Agency's (ESA's) MEdium Resolution Imaging Spectrometer (MERIS) sensor on the Envisat satellite (2002-2012) and ESA's Ocean and Land Colour Instrument (OLCI) sensor on the Sentinel 3A and Sentinel 3B satellites (2016-present). Citation: Binding, C.E., Pizzolato, L., & Zeng, C. (2021). EOLakeWatch; delivering a comprehensive suite of remote sensing algal bloom indices for enhanced monitoring of Canadian eutrophic lakes. Ecological Indicators, 121, 106999. doi:10.1016/j.ecolind.2020.106999
-
Jackfish Bay was identified as an Area of Concern (AOC) in 1987 due to degraded water and sediment quality and environmental health, which included impairment to benthic communities. As part of the Great Lakes Action Plan, assessments of benthic conditions in the Jackfish Bay AOC have been conducted periodically since 2003. Using information from four assessment components – sediment chemistry, sediment toxicity, benthic community structure, and resident invertebrate contaminant bioaccumulation – overall and assessment component-specific conditions were determined. In 2011, the AOC was designated an Area in Recovery, obligating federal and provincial governments to implement a long-term plan to monitor recovery. The last assessment conducted in 2013 indicated continuing adverse conditions, particularly nearest to the mill effluent discharge. The current project (2019) supported the Jackfish Bay monitoring plan. The objectives of the 2019 study were to: 1) Determine whether conditions are significantly different from reference conditions and, if so, to what degree and spatial extent; 2) Evaluate whether benthic conditions in Jackfish Bay are improving over time.
-
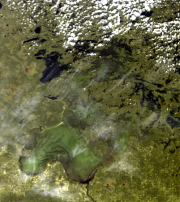
This dataset contains lake-wide algal bloom indices (extent, intensity, and severity) of Lake of the Woods on a daily basis over the June through October monitoring season. These data are derived from satellite remote sensing algorithms using European Space Agency's (ESA's) MEdium Resolution Imaging Spectrometer (MERIS) sensor on the Envisat satellite (2002-2012) and ESA's Ocean and Land Colour Instrument (OLCI) sensor on the Sentinel 3A and Sentinel 3B satellites (2016-present). Citation: Binding, C.E., Pizzolato, L., & Zeng, C. (2021). EOLakeWatch; delivering a comprehensive suite of remote sensing algal bloom indices for enhanced monitoring of Canadian eutrophic lakes. Ecological Indicators, 121, 106999. doi:10.1016/j.ecolind.2020.106999