
2020
Type of resources
Topics
Keywords
Contact for the resource
Provided by
Years
Formats
Representation types
Update frequencies
status
-
With the changing climate conditions, marine traffic along Canada’s coastal regions has increased over the past couple of decades and the need to improve our state of preparedness for oil-spill-related emergencies is critical. Baseline coastal information, such as shoreline form, substrate, and vegetation type, is required for prioritizing operations, coordinating onsite spill response activities (i.e. Shoreline Cleanup Assessment Technique [SCAT]), and providing information for wildlife and ecosystem management. Between 2010 and 2017, georeferenced high-definition videography and photos were collected for various study sites across coastal Canada. The study areas include Beaufort Sea, Mackenzie Delta channels and Banks Island in the western Canadian Arctic; James Bay, Hudson Bay, Nunavik, Resolute Bay, Victoria Strait, Baffin Island and Coronation Gulf in the eastern Canadian Arctic; Labrador, Bay of Fundy and Chedabucto Bay in Atlantic Canada and Kitimat, Haida Gwaii and Burrard Inlet in the northern Pacific. Data was collected during ice-free and low tide conditions (where applicable) between July and September. Low-altitude helicopter surveys were conducted at each study site to capture video of the shoreline characteristics. In addition to acquiring videography, ground-based observations were recorded in several locations for validation. Shoreline segmentation was then carried out by manual interpretation of the oblique videography and the photos aided by ancillary data. This involved splitting and classifying the shoreline vectors based on homogeneity of the upper intertidal zone. Detailed geomorphological information (i.e. shoreline type, substrate, slope, height, accessibility etc.) describing the upper intertidal, lower intertidal, supratidal and backshore zones was extracted from the video and entered into a geospatial database using a customized data collection form. In addition, biological characteristics like biobands, water features, fauna, human use etc. observed along the coast were recorded. The data was also validated through ground samples (when available) and a second interpreter QA (quality analysis) was performed on each dataset (excluding Nunavik) to ensure high quality and consistency. The final dataset contains segments ranging in length from 150 metres to 2500 metres. In total, from 2010 to 2017, within the 14 study sites, about 26,150 km of shoreline were mapped.
-
The Regional Air Quality Deterministic Prediction System FireWork (RAQDPS-FW) carries out physics and chemistry calculations, including emissions from active wildfires, to arrive at deterministic predictions of chemical species concentration of interest to air quality, such as fine particulate matter PM2.5 (2.5 micrometers in diameter or less). Geographical coverage is Canada and the United States. Data is available at a horizontal resolution of 10 km. While the system encompasses more than 80 vertical levels, data is available only for the surface level. The products are presented as historical, annual or monthly, averages which highlight long-term trends in cumulative effects on the environment.
-
The objectives of the present study were to evaluate the chronixc effects of 2 BZT‐UVs alone and in a mixture, 2‐(2H‐benzotriazol‐2‐yl)‐4,6‐bis(1‐methyl‐1‐phenylethyl)phenol (UV‐234) and 2‐(2H‐benzotriazol‐2‐yl)‐4,6‐di‐tert‐pentylphenol (UV‐328), in juvenile rainbow trout (Oncorhynchus mykiss) chronically exposed (for 28 d) through the diet. Chemical analyses were used to measure liver accumulation of the 2 compounds in exposed trout. Hepatic RNA‐sequencing and qRT-PCR were used to measure gene transcription levels in exposed fish. Results were published in a scientific article that can be found here: https://doi.org/10.1002/etc.4676
-
This dataset is part of the International Atomic Energy Agency (IAEA) Global Network of Isotopes in Precipitation (GNIP) project and contains the total monthly precipitation quantity in millimeters collected on the roof of the National Hydrology Research Centre in Saskatoon, SK and its stable oxygen (δ18O) and hydrogen (δ2H) isotope ratios data from June 1990 to January 2020. Up until 2013, a MSC copper rain gauge, modified to hold a HDPE bottle containing a thin layer of paraffin oil to prevent evaporation collected the summer precipitation. Summer precipitation collection from 2013 onward used a Palmex integrator. A plastic 20 L bucket emptied after each snow event collected the winter precipitation until 2015 when we switched to a MSC Nipher shielded snow gauge. To determine the quantity, the collected precipitation was weigh at the beginning of each month. The precipitation’s ratios of stable oxygen (δ18O) and hydrogen (δ2H) isotopes was determined using the IAEA GNIP manual. IAEA. Statistical treatment of data on environmental isotopes in precipitation. Vienna: International Atomic Energy Agency; 1992. (Technical Series Report; 331).
-
The toxic effects of a representative mixture (mining activities) of rare earth elements are studied in the hydra, an organism particularly sensitive to these elements. All data are a part subject of a publication containing method details, full QA/QC, interpretation and conclusions. Citation: Hanana, H., Gagné, F., Trottier, S., Bouchard, P., Farley, G., Auclair, J., & Gagnon, C. (2022). Assessment of the toxicity of a mixture of five rare earth elements found in aquatic ecosystems in Hydra vulgaris. Ecotoxicology and environmental safety, 241, 113793. doi.org/10.1016/j.ecoenv.2022.113793
-
This project examined the use of parasites of slimy sculpin (Cottus cognatus) as indicators of water quality in the Athabasca River. Specimens of C. cognatus were sampled from four tributaries to assess patterns of helminth parasite community structure in this fish and to study the composition and diversity of its parasite communities in relation to water quality. All data are a part subject of a publication containing method details, full QA/QC, interpretation and conclusions: Braicovich, P. E., McMaster, M., Glozier, N. E., & Marcogliese, D. J. (2020). Distribution of parasites of slimy sculpin Cottus cognatus Richardson, 1836 (Scorpaeniformes: Cottidae) in the Athabasca drainage, Alberta, Canada, and their relation to water quality. Parasitology research, 119(10), 3243–3254. doi.org/10.1007/s00436-020-06819-9
-
This dataset contains the stable nitrogen (δ15N), carbon (δ13C), oxygen (δ18O), and hydrogen (δ2H) isotope data from 1123 samples of underfur hair of adult polar bears (Ursus maritimus) sampled between 1992 to 2017 from subpopulation boundaries (zone) in the Canadian Arctic and sub-Arctic. Wide-ranging apex predators are among the most challenging of all fauna to conserve and manage. This is especially true of the polar bear, an iconic predator that is hunted in Canada and threatened by global climate change. We used combinations of stable isotopes (13C,15N,2H,18O) in polar bear hair to test the ability of stable isotopic profiles to ‘assign’ bears to (1) predefined managed subpopulations, (2) subpopulations defined by similarities in stable isotope values using quadratic discriminant analysis, and (3) spatially explicit, isotopically distinct clusters derived from interpolated (i.e. ‘kriged’) isotopic landscapes, or ‘isoscapes’, using the partitioning around medoids algorithm. A four-isotope solution provided the highest overall assignment accuracies (~80%) to pre-existing management subpopulations with accuracy rates ranging from ~30–99% (median = 64%). Assignment accuracies of bears to hierarchically clustered ecological groups based on isotopes ranged from ~64–99%. Multivariate assignment to isotopic clusters resulted in highest assignment accuracies of 68% (33–77%), 84% (47–96%) and 74% (53–85%) using two, three and four stable isotope groups, respectively. The resulting spatial structure inherent in the multiple stable isotopic compositions of polar bear tissues is a powerful forensic tool that will, in this case, contribute to the conservation and management of this species. Currently, it is unclear what is driving these robust isotopic patterns and future research is needed to evaluate the processes behind the pattern. Nonetheless, our isotopic approach can be further applied to other apex mammalian predators under threat, such as the large felids, providing that isotopic structure occurs throughout their range.
-
With the changing climate conditions, marine traffic along Canada’s coastal regions has increased over the past few decades and the need to improve our state of preparedness for oil-spill-related emergencies is critical. Baseline coastal information, such as shoreline form, substrate, and vegetation type, is required for prioritizing operations, coordinating onsite spill response activities (i.e., Shoreline Cleanup Assessment Technique [SCAT]), and providing information for wildlife and ecosystem management. Between 2011 and 2016, georeferenced high-definition videography and photos were collected for various study sites along the east coast. The study areas include Labrador, Bay of Fundy and Chedabucto Bay in Atlantic Canada. Data was collected during ice-free and low tide conditions (where applicable) between July and September. Low-altitude helicopter surveys were conducted at each study site to capture video of the shoreline characteristics. In addition to acquiring videography, ground-based observations were recorded in several locations for validation. Shoreline segmentation was then carried out by manual interpretation of the oblique videography and the photos aided by ancillary data. This involved splitting and classifying the shoreline vectors based on homogeneity of the upper intertidal zone. Detailed geomorphological information (i.e., shoreline type, substrate, slope, height, accessibility etc.) describing the upper intertidal, lower intertidal, supratidal and backshore zones was extracted from the video and entered into a geospatial database using a customized data collection form. In addition, biological characteristics like biobands, water features, fauna, human use etc. observed along the coast were recorded. The data was also validated through ground observations (when available) and a second interpreter QA (quality analysis) was performed on each dataset to ensure high quality and consistency. The final dataset contains segments ranging in length from 150 metres to 2500 metres. In total, from 2011 to 2016, within the 3 study sites, about 1,850 km of shoreline were mapped.
-
As indicated in the Notice with respect to certain quaternary ammonium compounds in Canadian commerce — Phase 1 (the Notice), and in accordance with section 49 of the Canadian Environmental Protection Act, 1999 (CEPA), the Government of Canada is providing a summary of the information received in response to the Notice, which was published in the Canada Gazette, Part I, on November 17, 2018 under section 46 of CEPA. The Notice collected information from manufacturers and importers (e.g., quantities and uses) on approximately 800 quaternary ammonium compounds (QACs) for the 2017 calendar year. The information will be used to support priority setting, and inform future risk assessments. The files in the resources section below offer an overview of the information gathered under this initiative including: type of submission; reported substances; substances that are manufactured or imported; industrial sectors involved; substance functions and commercial applications; and intended use (in commercial activity, in consumer activity, and by children). It should be noted that these documents do not include an assessment of the potential risks these substances may pose to the environment or to the health of Canadians. To complement the information summary document, a compilation of the non-confidential information received is available for download in Excel and CSV formats and includes a list of the substances for which no information was submitted. Important information about this summary: To protect confidential business information, in some cases quantitative data is presented in ranges and qualitative data is excluded. Qualitative data includes information that characterizes and categorizes information [e.g., company names, North American Industry Classification System (NAICS) codes, specified uses, Substance Function Codes, and Application Codes]. Since the dataset does not include confidential business information, the figures presented may be an underestimate. Code 999 "Other" was provided for a Substance Function Code or an Application Code, it indicates that the codes listed in the Notice did not apply and a description of the function or use was required. Please refer to the Notice or guidance document for further details on data collected. Supplemental Information Useful links: http://gazette.gc.ca/rp-pr/p1/2018/2018-11-17/html/notice-avis-eng.html https://www.canada.ca/en/health-canada/services/chemical-substances/chemicals-management-plan/initiatives/transparency-risk-assessment-activities.html https://www.canada.ca/en/health-canada/services/chemical-substances/inventory-updates.html https://www.canada.ca/content/dam/eccc/documents/pdf/pded/quats/Guidance-manual-QAC.pdf https://www.canada.ca/content/dam/eccc/documents/pdf/pded/quats/20190312-QAC-s-46-substances-en-fr.xlsx
-
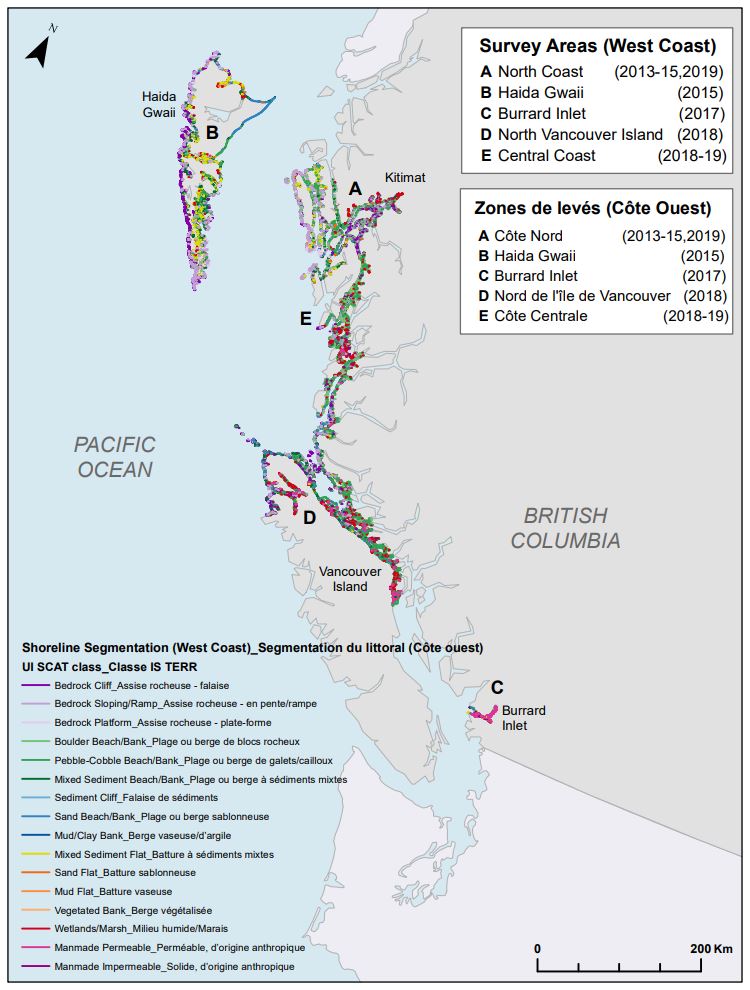
With the changing climate conditions, marine traffic along Canada’s coastal regions has increased over the past couple of decades and the need to improve our state of preparedness for oil-spill-related emergencies is critical. Baseline coastal information, such as shoreline form, substrate, and vegetation type, is required for prioritizing operations, coordinating onsite spill response activities (i.e. Shoreline Cleanup Assessment Technique [SCAT]), and providing information for wildlife and ecosystem management. Between 2013 and 2019, georeferenced high-definition videography and photos were collected for various study sites along the west coast. The study areas include the mainland, inlets, channels and islands along the BC coast starting from Kitimat in the north to Quadra Island in the south, including Haida Gwaii and North Vancouver Island in the west and Burrard Inlet in the extreme south. Data was collected during low tide conditions (where applicable) between July and September. Low-altitude helicopter surveys were conducted at each of the study site to capture video of the shoreline characteristics. In addition to acquiring videography, ground-based observations were recorded in several locations for validation. Shoreline segmentation was then carried out by manual interpretation of the oblique videography and the photos aided by ancillary data. This involved splitting and classifying the shoreline vectors based on homogeneity of the upper intertidal zone. Detailed geomorphological information (i.e. shoreline type, substrate, slope, height, accessibility etc.) describing the upper intertidal, lower intertidal, supratidal and backshore zones was extracted from the video and entered into a geospatial database using a customized data collection form. In addition, biological characteristics like biobands, water features, fauna, human use etc. observed along the coast were recorded. The data was also validated through ground samples (when available) and a second interpreter QA (quality analysis) was performed on the dataset to ensure high quality and consistency. The final dataset contains segments ranging in length from 150 metres (45 metres for study areas surveyed in 2018-19) to 2500 metres. In total, from 2013 to 2019, about 15,000 km of shoreline were segmented.