
2012
Type of resources
Topics
Keywords
Contact for the resource
Provided by
Years
Formats
Representation types
Update frequencies
status
-
Monitor variations in seabird numbers and colony size in the St. Lawrence system. Survey of over 20 species of seabirds and herons during the breeding season, in order to monitor population dynamics through time and space. Seabird populations are influenced by food abundance and quality. There is actually more than 1,000,000 birds from more than 20 different species that breed in nearly 1,000 active colonies. Plongeon du Pacifique/Pacific Loon/Gavia Pacifica, Plongeon catmarin/Red-throated Loon/Gavia stellata, Macareux moine/Atlantic Puffin/Fratercula arctica, Guillemot à miroir/Black Guillemot/Cepphus grylle, Guillemot marmette/Common Murre/Uria aalge, Guillemot de Brünnich/Thick-billed Murre/Uria lomvia, Petit Pingouin/Razorbill/Alca torda, Mouette tridactyle/Black-legged Kittiwake/Rissa tridactyla, Goéland marin/Great Black-backed Gull/Larus marinus, Goéland argenté/Herring Gull/Larus argentatus, Goéland à bec cerclé/Ring-billed Gull/Larus delawarensis, Mouette rieuse/Common Black-headed Gull/Larus ridibundus, Sterne caspienne/Caspian Tern/Sterna caspia, Sterne pierregarin/Common Tern/Sterna hirundo, Sterne arctique/ArcticTern/Sterna paradisaea, Sterne de Dougall/Roseate Tern/Sterna dougallii, Océanite cul-blanc/Leach's Storm-Petrel/Oceanodroma leucorhoa, Fou de Bassan/Northern Gannet/Morus bassanus, Grand Cormoran/Great Cormorant/Phalacrocorax carbo, Cormoran à aigrettes/Double-crested Cormorant/Phalacrocorax auritus, Eider à duvet/Common Eider/Somateria mollissima, Grand Héron/Great Blue Heron/Ardea herodias, Bihoreau gris/Black-crowned Night-Heron/Nycticorax nycticorax.
-
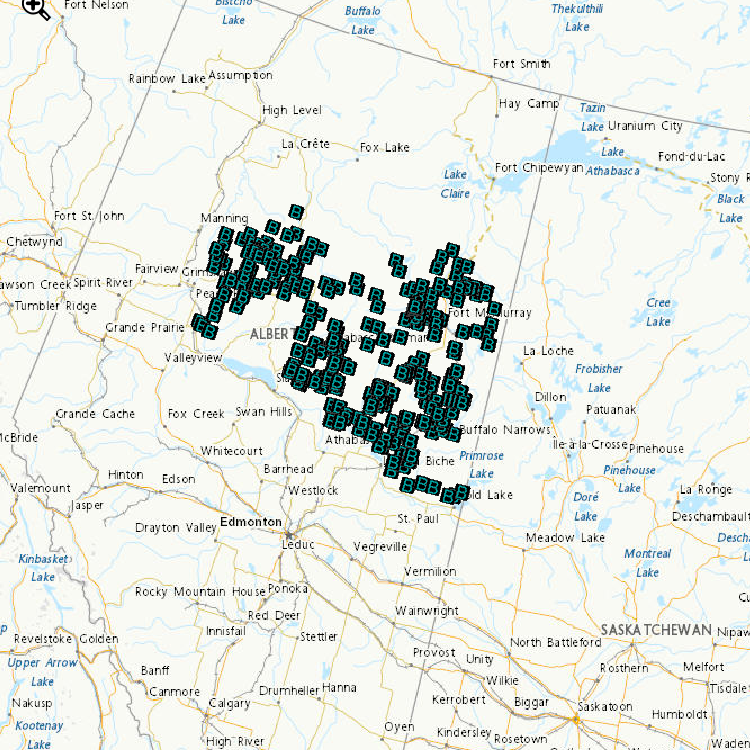
Environment and Climate Change Canada’s cause-effect monitoring is focused on understanding how boreal songbirds, including several Species at Risk, are affected by human activity in the oil sands area, particularly the impact of the physical disturbance of forested habitats from exploration, development and construction of oil sands. Determining the abundance of songbird species associated with various habitat type(s) and understanding how the type and number of birds varies with type and amount of habitat, are important components of assessing the effect of habitat disturbance. Regional-scale monitoring focuses on understanding how and why boreal songbirds, including several Species at Risk, are affected by human activity across the Peace, Athabasca and Cold Lake oil sands area. Local-scale projects focus on addressing gaps in our understanding of complex response patterns at regional scales by targeting specific habitats or development features of interest. These data contribute to: a. improving the design of monitoring programs; b. explaining observed trends in populations (why bird populations are increasing or decreasing); c. predicting population sizes within the oil sands area; and d. assessing the individual, additive and cumulative effects of oil sands and other resource development on boreal birds. Data are used by ECCC and our partners to develop new models and increase the robustness of existing models of bird responses to habitat and disturbance. Because models can be used to predict outcomes of future land management scenarios, these models can assist decision-making by helping evaluate land-use choices before impacts are directly observed.
-
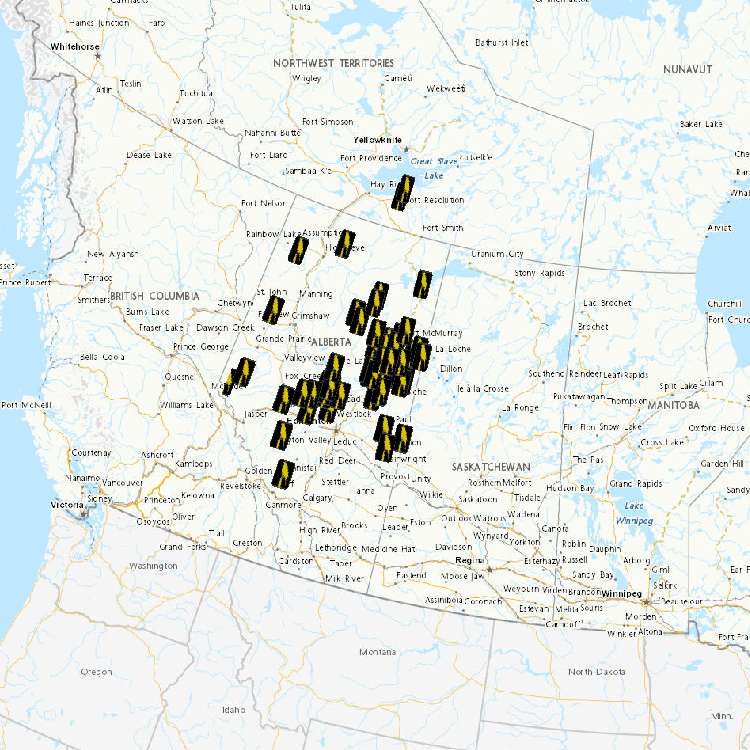
Waterfowl and mammals harvested and trapped at various locations in the oil sands region and in reference locations are assessed for contaminant burdens and toxicology. Wildlife samples are obtained from local hunters and trappers. Tissue samples are analysed for concentrations of oil sands-related contaminants (heavy metals, polycyclic aromatic hydrocarbons, and naphthenic acids). Dead and moribund birds collected from tailing ponds are also evaluated for levels and effects of contaminants.
-
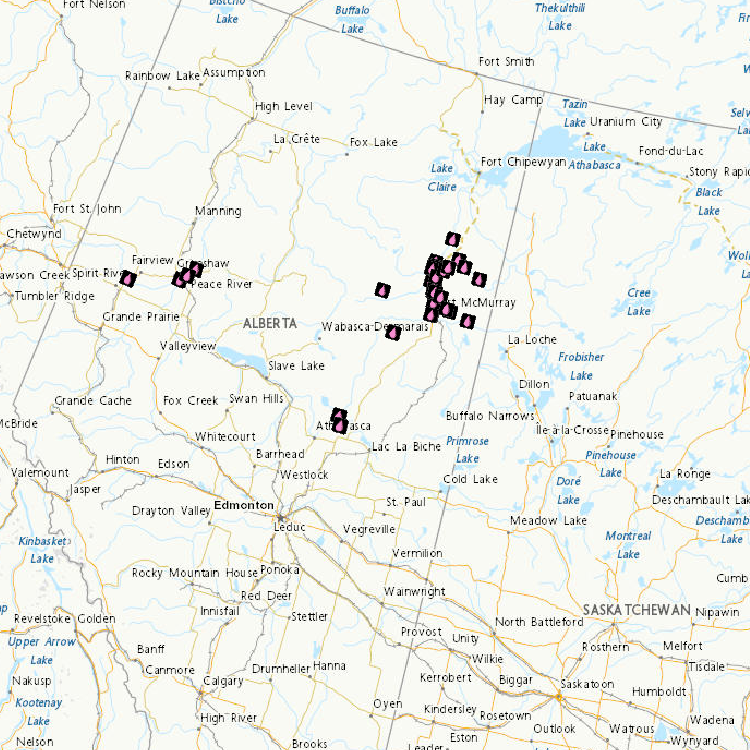
The objectives of the fish component of the integrated oil sands monitoring program are to provide the necessary data/information to address key questions related to both environmental health of fish populations and fish health issues that can be used to inform human use and consumption. The questions underlying the fish monitoring design are related to the status and health of wild fish populations in the Lower Athabasca River including and in an expanded geographical extent. Data is being collected to provide a baseline against which future changes in fish populations will be evaluated, and compared to data from historical studies to assess change over time to the current state. Data is also being collected in areas of new oil sands development, to develop baseline data for future site-specific comparisons, contribute to an expanded geographic basis of the overall monitoring plan, and contribute to an improved ability to examine cumulative effects.
-
Recent and historical deposition of mercury (Hg) are examined over a broad geographic area from southwestern Northwest Territories to Labrador and from the U.S. Northeast to northern Ellesmere Island using dated sediment cores from 50 lakes (18 in midlatitudes (41-50 degrees North), 14 subarctic (51-64 degrees North) and 18 in the Arctic (65-83 degrees North)). Objectives were to quantify latitudinal and longitudinal trends of anthropogenic mercury deposition in eastern and northern North America, to investigate variations in mercury deposition, to examine relationships with lake area, catchment/lake area ratio and sedimentation rates, and to compare results with model predictions. Distinct increases of mercury over time were observed in 76% of Arctic, 86% of subarctic and 100% of midlatitude cores. Subsurface maxima in mercury depositional fluxes were observed in only 28% of midlatitude lakes and 18% of arctic lakes, indicating little recent reduction of inputs. Anthropogenic mercury fluxes adjusted for sediment focusing and changes in sedimentation rates were negatively correlated with latitude. The latitudinal trend for anthropogenic mercury fluxes adjusted for sediment focusing and changes in sedimentation rates values showed excellent agreement with predictions of the global/regional atmospheric heavy metal (mercury) model (GRAHM) for the geographic location of each lake. The results are consistent with a scenario of slow atmospheric oxidation of mercury, and slow deposition of reactive mercury emissions, declining with increasing latitude away from emission sources in the midlatitudes, and support the view that there are significant anthropogenic mercury inputs in the Arctic.
-
Water quality and suspended sediment monitoring and surveillance data collected from the connecting channels of the Great Lakes to determine baseline water quality status, long term trends and spatial distributions, the effectiveness of management actions, determine compliance with sediment quality objectives and identify emerging issues are included in this dataset. The Great Lakes are joined together by river systems known collectively as connecting channels, including the St. Marys River, the St. Clair River (and Lake St. Clair), the Detroit River, the Niagara River, and the St. Lawrence River. Uniquely, the connecting channels originate from the outflow of one or more large, oligotrophic lakes rather than the accumulation of a network of tributaries.
-
In 2012 samples of raw influent and final effluent wastewater from five municipal wastewater treatment plants at various locations in Canada (sites to remain anonymous, designated in this data file as MH, OX, Q, TB, U). Also, leachate was collected from three landfill sites (sites to remain anonymous, designated in this data file as Q, TB and MH). The samples were analyzed for four artificial sweeteners (acesulfame, saccharin, cyclamate, sucralose), perchlorate, six anionic pesticides (glyphosate, 2,4-D, glufosinate, fosamine, MCPA, picloram) and a metabolite of glyphosate (AMPA). These data have not been published previously. Please see supporting document for methods for the analyses.
-
Sediment profile imagery (SPI) (also known as REMOTS (Rhoads and Germano, 1982)) facilitates the assessment of the biophysical processes that occur in the benthic environment through the acquisition and analysis of high resolution images of vertical sections and surfaces of the seafloor. The SPI apparatus incorporates the use of a 12-megapixel Digital SLR camera to obtain in situ photographs of the first 20 cm of the seafloor. Because the sediment is not disturbed in the process, SPI photographs provide information on the physical and biological components of the seabed that is not readily available using traditional methods. From 2012 to 2019, 17 SPI datasets were acquired at 13 disposal at sea sites in British Columbia to monitor the environmental conditions of the sea floor. SPI & surface photographs, tabular data, and a geodatabase with attachments are provided in zipfolders for each study.
-
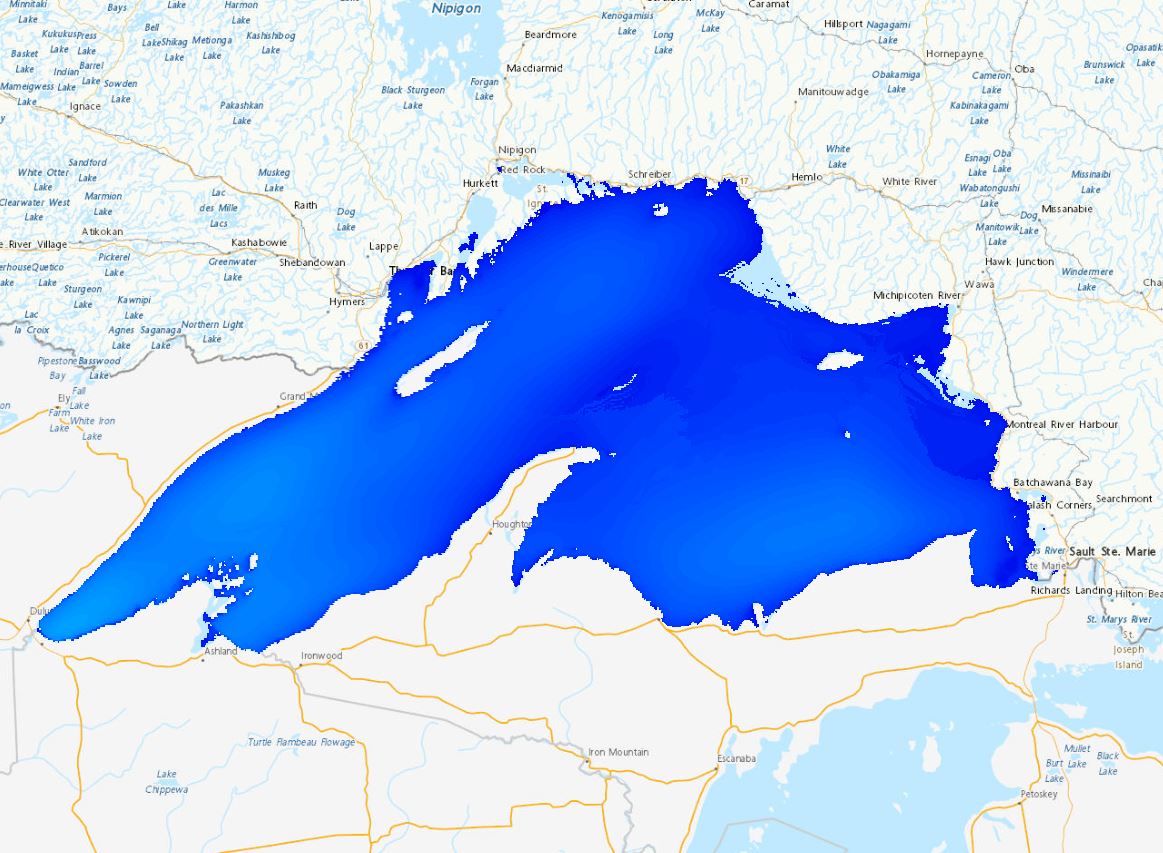
The Regional Deterministic Wave Prediction System (RDWPS) produces wave forecasts out to 48 hours in the future using the third generation spectral wave forecast model WaveWatch III® (WW3). The model is forced by the 10 meters winds from the High Resolution Deterministic Prediction System (HRDPS). Over the Great Lakes, an ice forecast from the Water Cycle Prediction System of the Great Lakes (WCPS) is used by the model to attenuate or suppress wave growth in areas covered by 25% to 75% and more than 75% ice, respectively. Over the ocean, an ice forecast from the Regional Ice Ocean Prediction System (RIOPS) is used: in the Northeast Pacific, waves propagate freely for ice concentrations below 50%, above this threshold there is no propagation; in the Northwest Atlantic the same logic is used as in the Great Lakes. Forecast elements include significant wave height, peak period, partitioned parameters and others. This system includes several domains: Lake Superior, Lake Huron-Michigan, Lake Erie, Lake Ontario, Atlantic North-West and Pacific North-East.
-
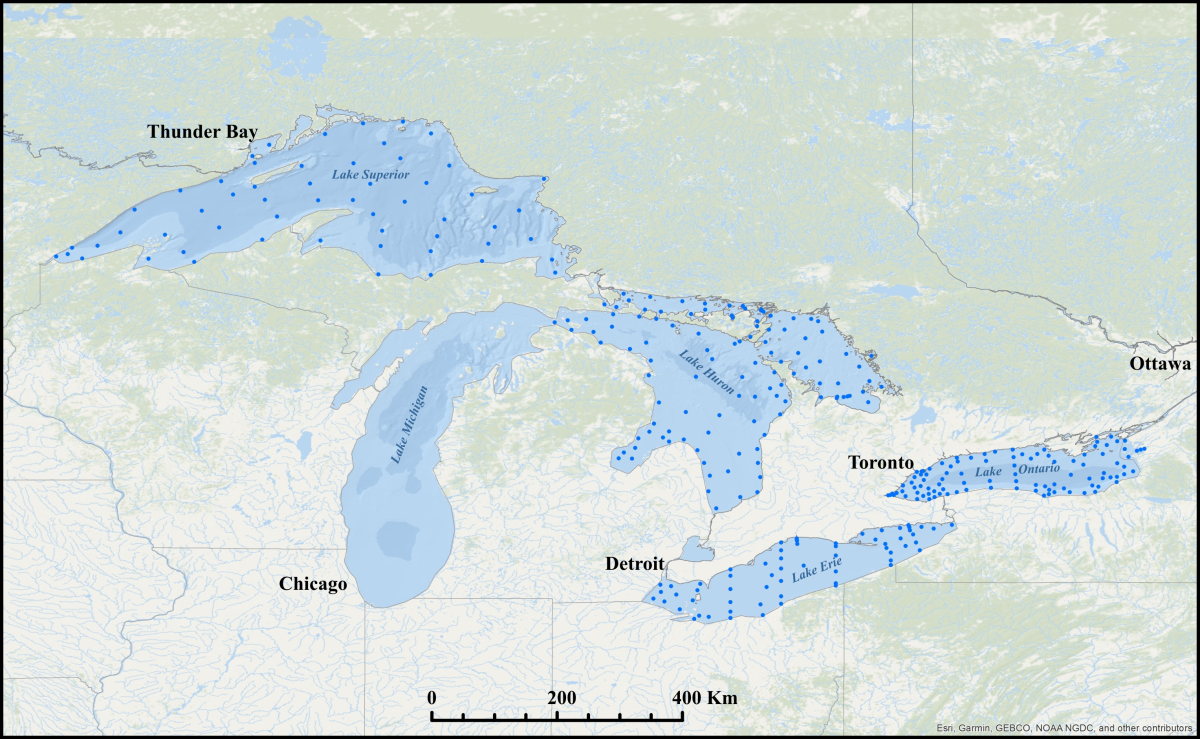
Water quality and ecosystem health data collected in the Great Lakes and priority tributaries to determine baseline water quality status, long term trends and spatial distributions, the effectiveness of management actions, determine compliance with water quality objectives and identify emerging issues are included in this dataset.