
2009
Type of resources
Topics
Keywords
Contact for the resource
Provided by
Years
Formats
Representation types
Update frequencies
status
-
Attribute data table which contains survey effort values for each season, total bird density, species richness value, species at risk score, and grid cell importance score.
-
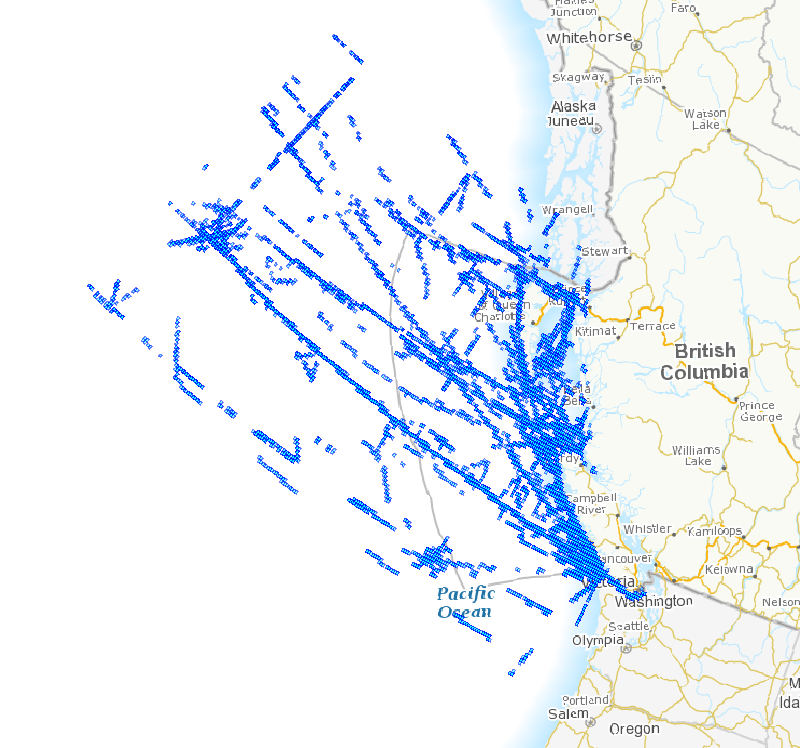
The Atlas of Pelagic Seabirds off the West Coast of Canada presents maps that display the distribution of 48 species of seabirds and two species pairs (i.e., Red-necked and Red Phalaropes, and Hawaiian and Galapagos Petrels). Seabird surveys were conducted aboard commercial and Canadian federal government ‘ships-of-opportunity’ from 1982-1983 and 1991-2005 within the study area (45° N to 58° N and from the coast to 148° W). Sightings of rare species that came from other sources (including some pre 1982 and post 2005) are also included in order to present as complete a picture as possible. For 33 species and one species pair, the average densities within 5’ latitude by 5’ longitude grid cells are displayed seasonally. The seabirds mapped in this manner include 11 species of Procellariiformes (albatrosses, fulmars, petrels, shearwaters and storm-petrels), and 24 species of Charadriiformes (phalaropes, skuas, gulls, terns and auks). The sighting locations for an additional 15 species and one species pair are also mapped. This group, comprised of 10 species of Procellariiformes and seven species of Charadriiformes includes species that are relatively uncommon to rare in the study area (but previously documented); and species that are extremely rare and/or have not been documented and thus remain unconfirmed. These data may be used to generate presence/absence and trends in and estimates of relative abundance. These data can also be used to examine patterns in temporal and spatial distribution. However, due to the opportunistic nature of the surveys, both in space and time, these data should not be used to determine absolute abundance. The rationale for developing this atlas was the recognized need for a product that could assist with: coastal zone and conservation area planning; emergency response to environmental emergencies; and identification of areas of potential interactions between seabirds and anthropogenic activities. In addition, the data used to develop the document provides a baseline to compare with future seabird distributions in order to measure the impacts of shifts in composition, abundance and/or distribution of prey, and climatic and oceanographic changes.
-
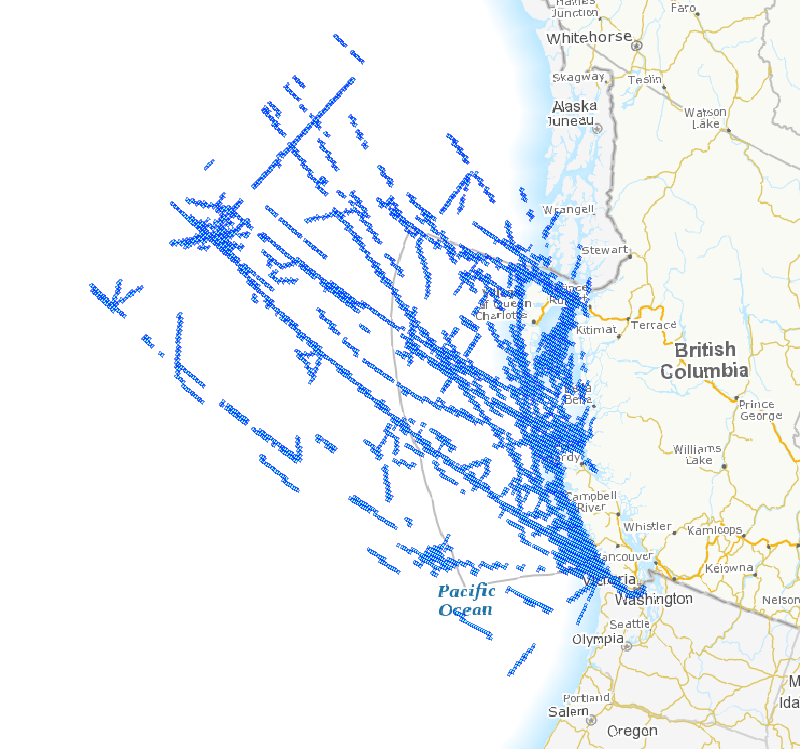
Grids surveyed is a polygon feature class containing the 5’ latitude by 5’ longitude grid cells surveyed for all seasons combined including the grids that were surveyed but where no species were seen. In order to produce maps for a specific season a selection for these grids must be performed.
-
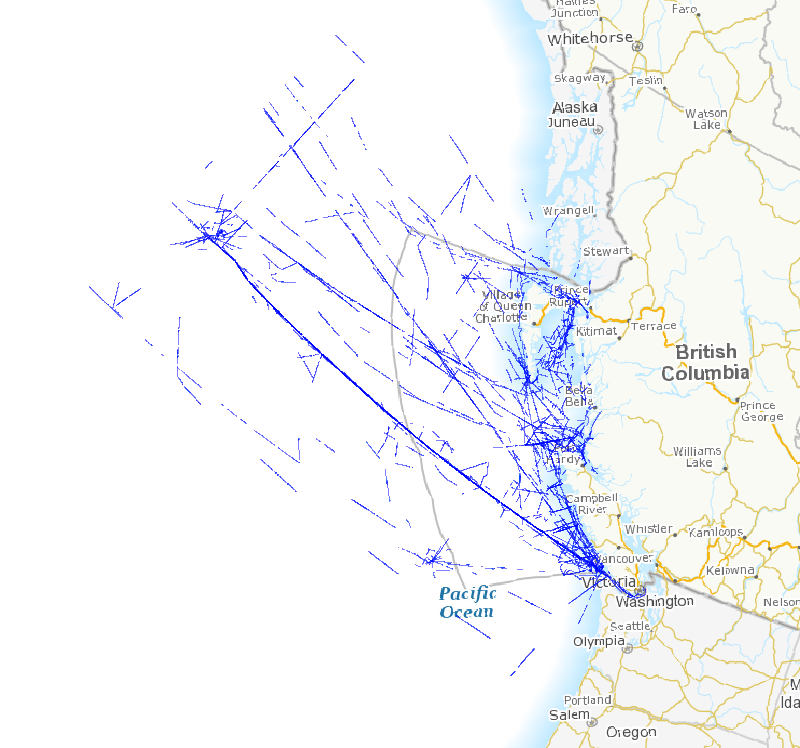
Survey effort is a polygon feature class with the original transects – for reference.
-
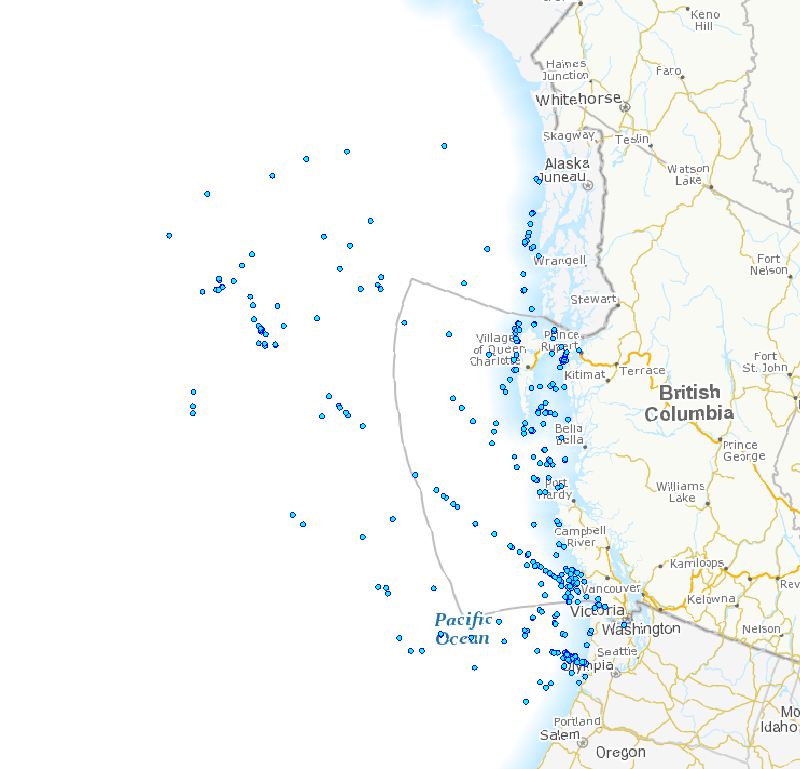
Rare species is a point feature class containing rare species sightings.
-
Mercury has been increasing in some marine birds in the Canadian Arctic over the past several decades. To evaluate the potential reproductive impact of mercury exposure, eggs of two species of arctic-breeding seabirds, the thick-billed murre and arctic tern, were dosed with graded concentrations of methylmercury and artificially incubated in the laboratory to determine species differences in sensitivity. Based on the dose-response curves, the median lethal concentrations (LC50) for thick-billed murre and arctic tern embryos were calculated. Compared with published LC50 values for other avian species, the murres and terns had a medium sensitivity to methylmercury exposure.
-
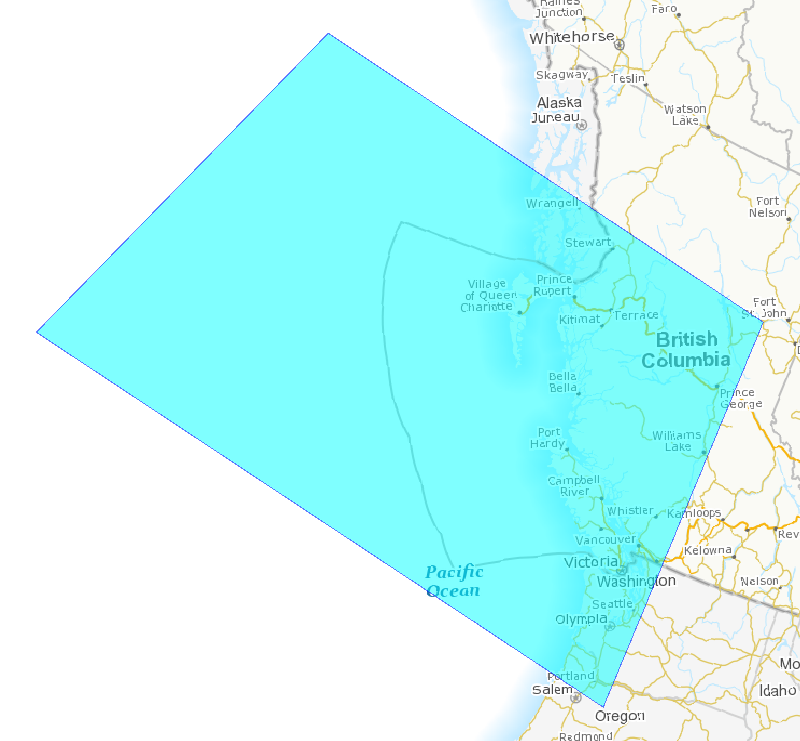
Study area is a polygon feature class showing the extent of where most of the bird sightings were recorded and then used in the atlas. A few rare species have been included as well that go beyond this area.
-
Average grid cell density is a polygon feature class containing the average density value for each grid cell per species/groups and season.