
RI_539
Type of resources
Topics
Keywords
Contact for the resource
Provided by
Years
Formats
Representation types
Update frequencies
status
-
This collection of data summarizes the companies reporting under the Renewable Fuels Regulations. This data set includes total liquid petroleum fuel volumes, renewable fuel volumes, and compliance unit creation. This data set also includes information on compliance by company. The information was provided to Environment and Climate Change Canada under the Canadian Environmental Protection Act, 1999.
-
These surveys focus on two abundant shorebird species, Western Sandpiper (Calidris mauri) and Dunlin (Calidris alpina), and are conducted at a large mudflat on Roberts Bank, Delta, British Columbia, approximately 35 km south of Vancouver. These survey counts began in 1991 and are conducted annually during the northern migration period (April and May). Species-specific counts are derived from total flock counts multiplied by an estimate of percentage composition of the two species. The Brunswick Point study site (49°03′ N, 123°09′ W) extends over the southern third of Roberts Bank, and encompasses a large mudflat (tidal range = 0 – 3.8 m) separated from agricultural fields by a dike. Vegetation in the near shore sections of the mudflat is composed mostly of saltmarsh and bushes. Sediments in the mudflat range from soft mud to sand, and portions of the lower intertidal zone are covered with eelgrass (Zostera marina and Z. japonica). A causeway supporting a major port facility separates the mudflat from the remainder of Roberts Bank, and the dike is used for recreational purposes. Total flock counts. The number of total flock counts conducted annually varied from seven to 15 counts from 1991 to 1998. Beginning in 1999, counts were conducted either daily or every other day during spring migration for an annual replicate of 17 32 counts. The migration period began on 15 April each year and continued until lesser than 1000 birds were observed or until 15 May, whichever came first. This timing was chosen to overlap with the major pulse of Western Sandpiper migration and also captured peak Dunlin numbers. Daily timing of surveys depended on the tide cycle; the start of surveys ranged between 05:45 and 19:00 hr. Counts were conducted at a tide height of 3.5 m, based on tidal predictions at Point Atkinson, British Columbia. This tide height ensured birds were close to shore, with sufficient mudflat exposed to present good feeding opportunities for shorebirds. Occasionally maximum daily tide heights did not reach 3.5 m, and counts on these days were conducted during the actual maximum tide heights. Counts began at the southern end of the Brunswick Point dike where it meets the Roberts Bank Superport causeway. All birds visible on the mudflat were counted from a vehicle along a series of stops on the dike, for a total length of ~2.5 km. Birds were counted through a spotting scope mounted on the vehicle window, primarily for distant flocks, and through binoculars to count birds near the vehicle. Flocks were counted by an initial assessment of flock density, and then by counting blocks incrementally in 50s, 100s, 500s, or 1000s, according to flock size, in each successive field of view across a scan of the entire flock. In 1992, the number of birds in large flocks was estimated by multiplying the number of square metres of mudflat covered by the flock by the average number of sandpipers in several 1-m2 plots estimated by eye (Butler 1994). Species composition: Only total flock counts were conducted prior to 1997, as deriving species-specific counts was complicated by the intermixing of Western Sandpipers and Dunlin in the large flocks. Species-specific counts are calculated as a product of total flock counts and percentage composition of different species. From 1997 onwards, relative species composition (ratio of Western Sandpipers to Dunlins) was estimated during supplementary counts as birds settled on the mudflats before or after the main shorebird counts described above. Numbers of Western Sandpipers and Dunlins were individually tallied along visually estimated 1 m wide strips that ran perpendicular from the dike to the water’s edge, and included both open mudflat and shallow water. Tallies of all strip counts were summed and the species proportion for that day was calculated as the number of each species counted divided by the total number of birds.
-
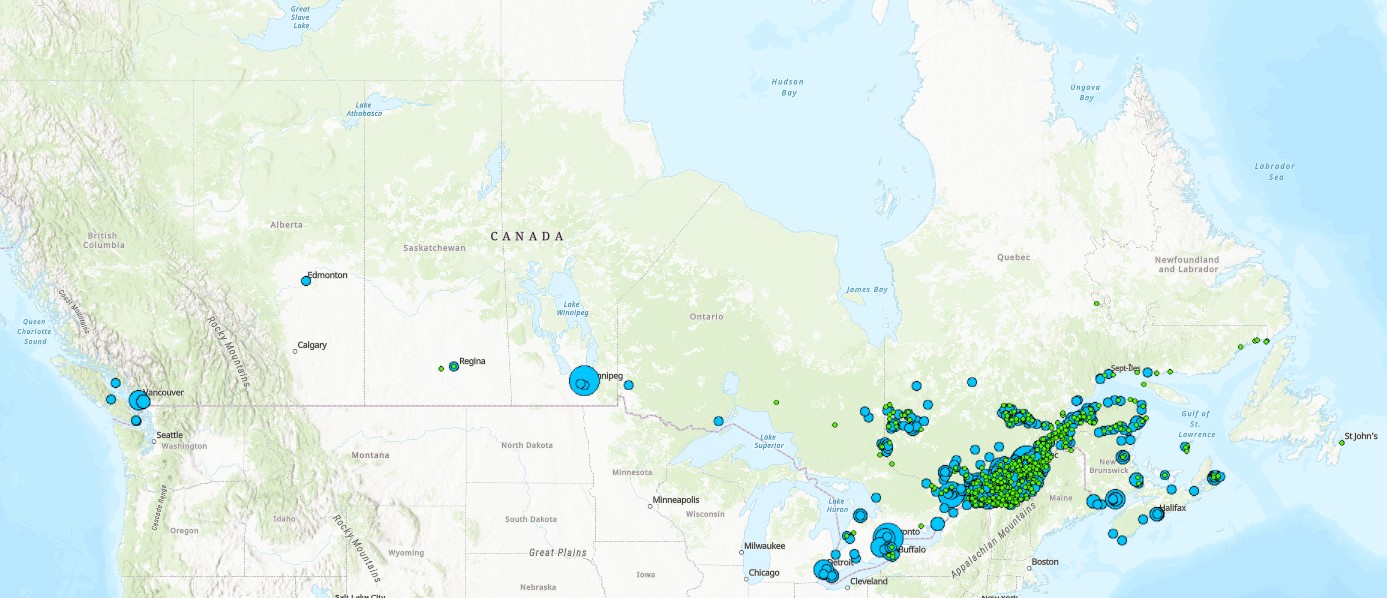
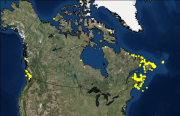
The Wastewater Systems Effluent Regulations (WSER), developed under the Fisheries Act, came into force in 2012 to manage wastewater releases by systems that collect an average daily influent volume of 100 cubic metres or more. The WSER also does not apply to any wastewater system located in the Northwest Territories, Nunavut and north of the 54th parallel in the provinces of Quebec and Newfoundland and Labrador. The WSER set national baseline effluent quality standards that are achievable through secondary wastewater treatment. The province of Quebec provided some combined sewer overflow data for 2020, which includes information on whether a discharge occurred at a combined sewer overflow point during the year. The map below shows the number of CSO points with at least one overflow event within each wastewater system. The map is available in both ESRI REST (to use with ARC GIS) and WMS (open source) formats. For more information about the individual reporting wastewater systems, datasets are available in either CSV or XLS formats. More information on the wastewater sector including the regulations, agreements, contacts and resource documents is available at: https://www.canada.ca/wastewater
-
This collection of data summarizes the companies and facilities reporting under the Fuels Information Regulations, No. 1. This dataset includes total fuel volumes, sulphur contents and masses, and companies reporting production and/or importation of liquid fuels originating from crude oils, coal or bituminous sand. The information was provided to Environment and Climate Change Canada under the Canadian Environmental Protection Act, 1999.
-
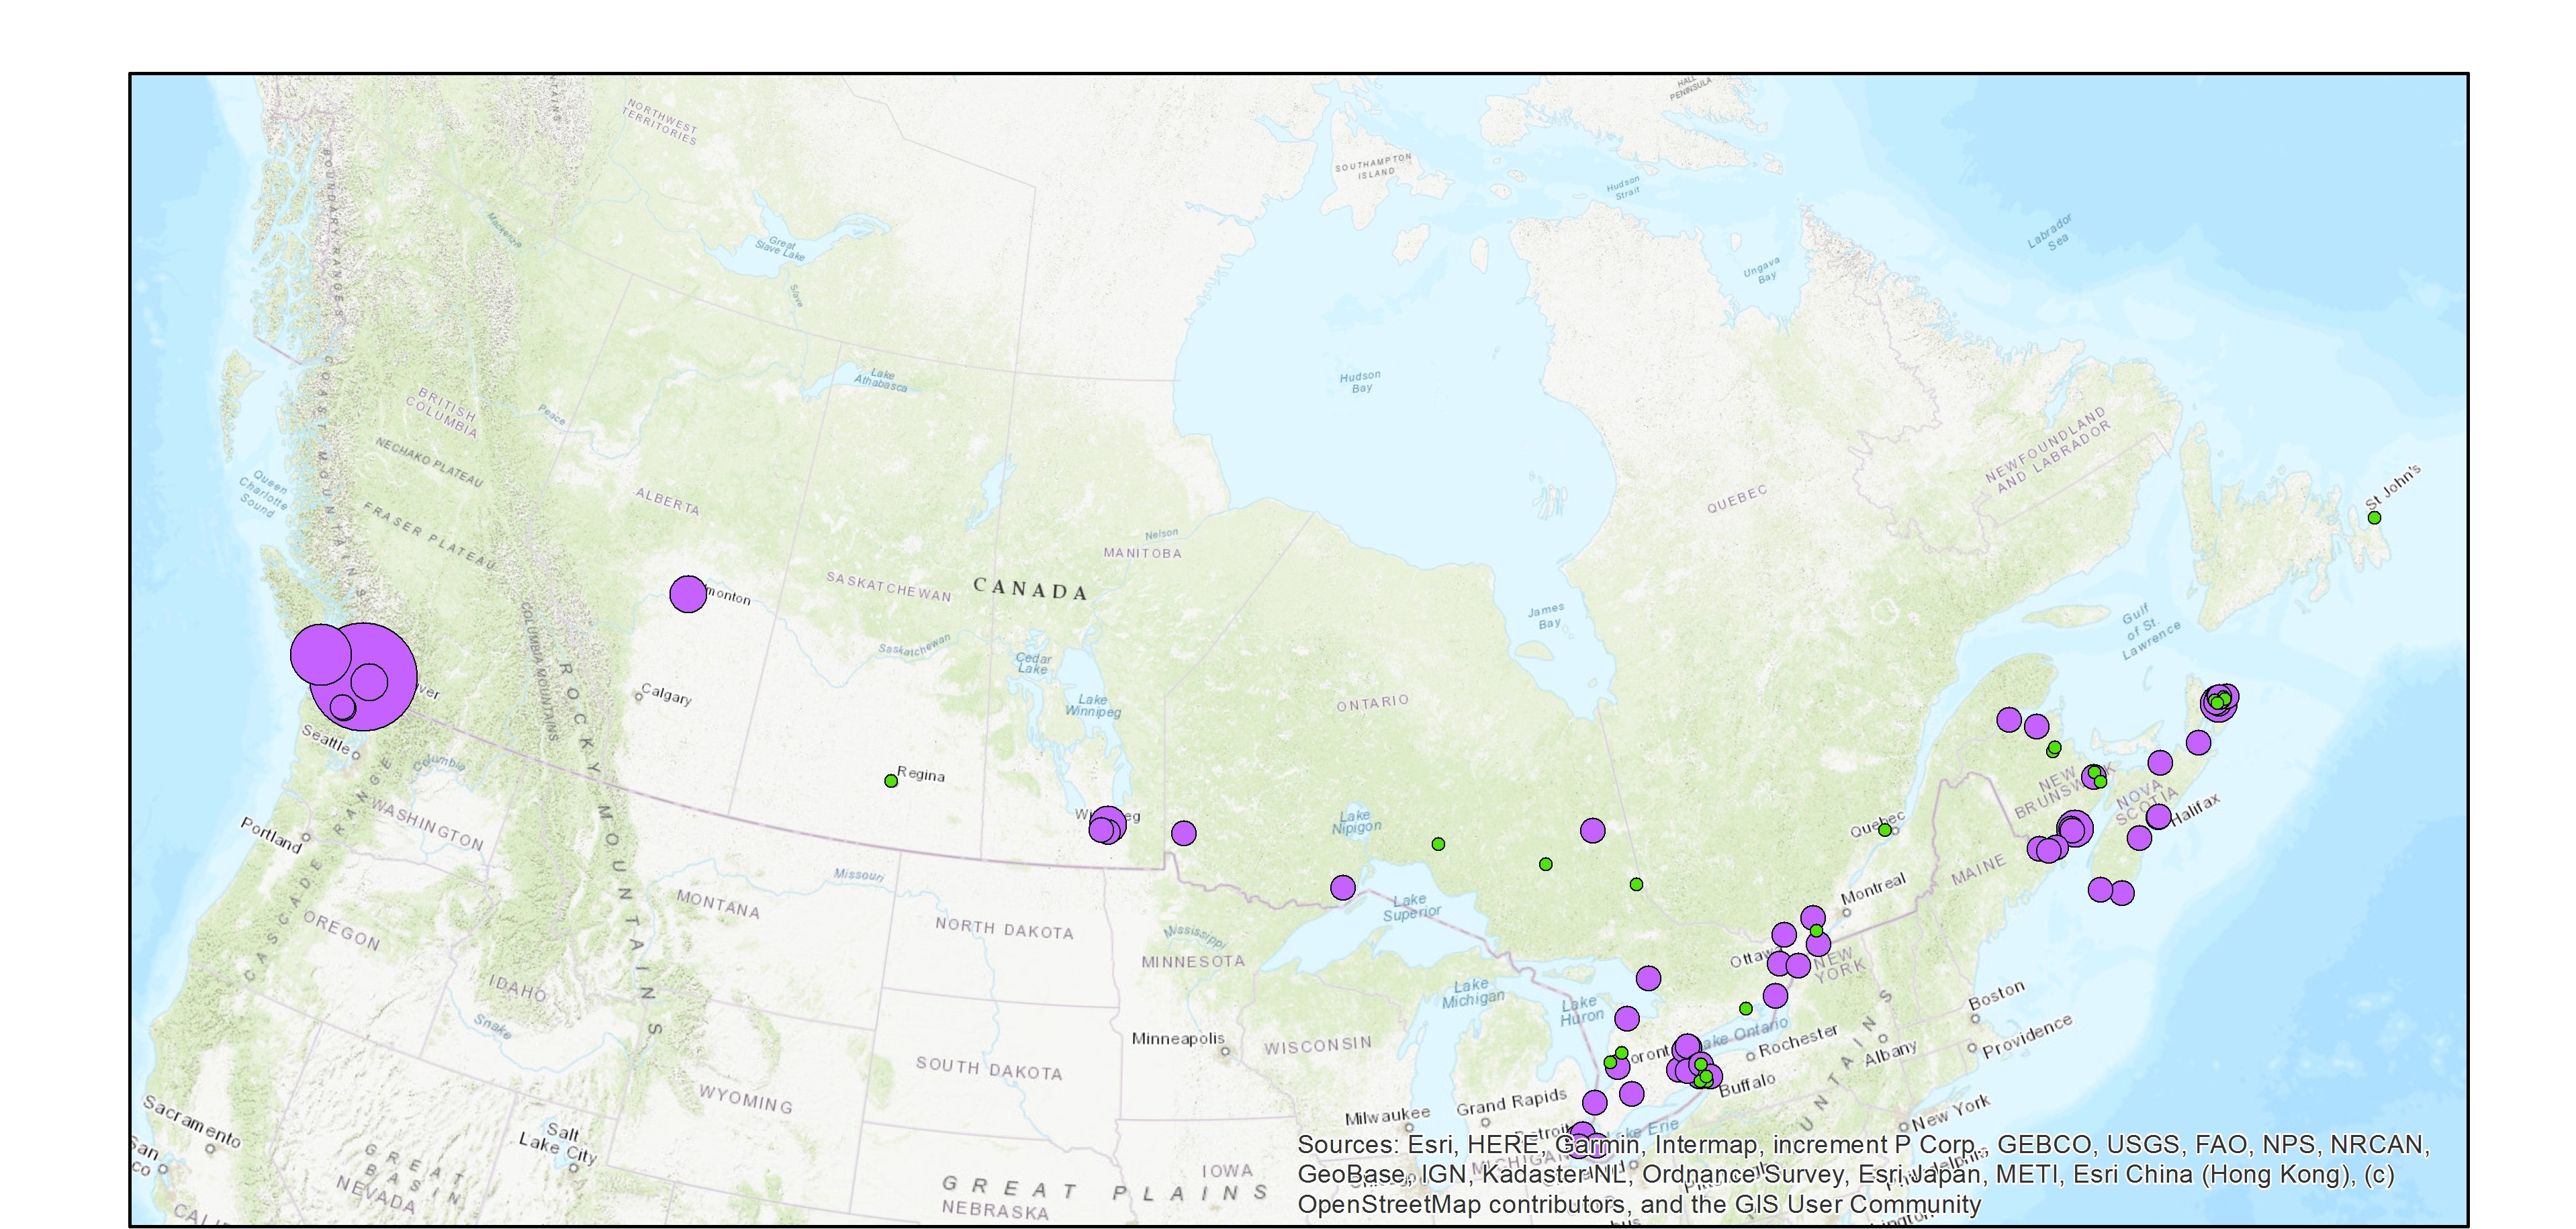
The Wastewater Systems Effluent Regulations (WSER), developed under the Fisheries Act, came into force in 2012 to manage wastewater releases by systems that collect an average daily influent volume of 100 cubic metres or more. The WSER also does not apply to any wastewater system located in the Northwest Territories, Nunavut and north of the 54th parallel in the provinces of Quebec and Newfoundland and Labrador. The WSER set national baseline effluent quality standards that are achievable through secondary wastewater treatment. The WSER require owners or operators of wastewater systems with combined sewers to submit an annual report on the total volume and the number of days wastewater is discharged per month via combined sewer overflow (CSO) points as a result of precipitation. The map below shows the volume of effluent (in cubic metres) discharged in a year from all CSO points situated within the collection area of a wastewater system. For the most part, the volumes provided to ECCC are estimates. Please note, a value of “999999999” in the dataset indicates that the volume data is unavailable and it does not mean that a volume of 999,999,999 m3 was released within the collection area of a wastewater system. The map is available in both ESRI REST (to use with ARC GIS) and WMS (open source) formats. For more information about the individual reporting wastewater systems, datasets are available in either CSV or XLS formats. Data from Quebec As of 2018, no combined sewer overflow volumes from Quebec municipalities are available since an equivalency agreement is now in effect. More information on the wastewater sector including the regulations, agreements, contacts and resource documents is available at: https://www.canada.ca/wastewater
-
As part of a scientific assessment of critical habitat for boreal woodland caribou (Environment Canada 2011, see full reference in accompanying documentation), Environment Canada's Landscape Science and Technology Division was tasked with providing detailed anthropogenic disturbance mapping across known caribou ranges. This data allowed researchers to better understand the attributes that have a known effect on caribou population persistence. The mapping process was established to create a nationally consistent, reliable and repeatable geospatial dataset that followed a common methodology. The methods developed were focused on mapping disturbances at a specific point of time, and were not designed to identify the age of disturbances, which can be of particular interest for disturbances that can be considered non-permanent, for example cutblocks. The resultant datasets were used for caribou resource selection function,habitat modeling, and assess overall disturbance levels on each caribou ranges. Anthropogenic disturbances within 57 caribou ranges across Canada were mapped. The ranges were defined by individual Provinces and Territories across Canada. Disturbances were mapped across these ranges using 2008-2010 Landsat-5 satellite imagery to provide the most up to date data possible. Originally some areas were mapped to match the date of collected caribou demographic data, however more recent imagery was used and additional disturbance features that were seen since the original mapping date were added. Within the context of this project, anthropogenic disturbance was defined as any human-caused disturbance to the natural landscape that could be visually identified from Landsat imagery at a viewing scale of 1:50,000. A minimum mapping unit (MMU) of 2 ha or approximately 22 contiguous Landsat pixels was selected. Each disturbance feature type was represented in the database by a line or polygon depending on their geometric description. Polygonal disturbances included: cutblocks, mines, reservoirs, built-up areas, well sites, agriculture, oil and gas facilities, as well as unknown features. Linear disturbances included: roads, railways, powerlines, seismic exploration lines, pipelines, dams, air strips, as well as unknown features. For each anthropogenic feature type, a clear description was established (see Appendix 7.2 of the science assessment) to maintain consistency in identifying the various disturbances in the imagery by the different interpreters. Various ancillary vector datasets were used as aids in detecting, classifying and digitizing disturbances on the Landsat imagery (a table listing these datasets and their sources has been included in a separate file). Ancillary data was used to guide interpretation and feature labelling since the ancillary data was often variable across the country in terms of completeness as well as scale. As a result, features were only digitized if they were visible in the Landsat imagery at a viewing scale of 1:50,000. A 2nd interpreter quality control phase was carried out to ensure high quality, completete and consistent data collection. A quality assessment analysis, since an actual accuracy assessment was not possible, using high resolution SPOT imagery was carried out on a sample basis. Results are included in accompanying documentation. The vector data was buffered by 500m (radius) representing the zone of influence impacting boreal caribou herds in order to calculate range disturbance levels as well as for use in the integrated risk assessment analysis. Fire polygons were merged into the anthropogenic footprint in order to create an overall disturbance footprint.
-
The National Pollutant Release Inventory (NPRI) is Canada's public inventory of pollutant releases (to air, water and land), disposals and transfers for recycling. This file is a geodatabase (GDB) that shows the locations of all facilities that reported to the NPRI in the current reporting year. The data are also available in a virtual globe format : https://open.canada.ca/data/en/dataset/d9be6bec-47e5-4835-8d01-d2875a8d67ff Please consult the following resources to enhance your analysis: - Guide on using and Interpreting NPRI Data: https://www.canada.ca/en/environment-climate-change/services/national-pollutant-release-inventory/using-interpreting-data.html - Access additional data from the NPRI, including datasets and mapping products: https://www.canada.ca/en/environment-climate-change/services/national-pollutant-release-inventory/tools-resources-data/exploredata.html
-
Canada has the longest coastline in the world, measuring 243,790 kilometers. Many of our waterways along the coastline have to be dredged regularly to keep shipping channels and harbours open and safe for navigation; and this material is sometimes best disposed of at sea. Schedule 5 of the Canadian Environmental Protection Act, 1999 (CEPA) defines an exclusive list of materials and substances suitable for disposal at sea in Canada, which is in accordance with the London Protocol (1996). They are: dredged material, fish waste resulting from industrial fish processing operations, ships or platforms, inert and inorganic geological matter, uncontaminated organic matter of natural origin, and bulky substances. The disposal of any substance into the sea, on the seabed, in the subsoil of the seabed, or onto ice, from a ship, an aircraft, a platform or other structure is not allowed unless a permit is issued by the Environment and Climate Change Canada (ECCC) Disposal at Sea Program. Incineration at sea, as well as importing or exporting a substance for disposal at sea is also prohibited. More information on Disposal at Sea is available at: https://www.canada.ca/en/environment-climate-change/services/disposal-at-sea.html The Active and Inactive Disposal at Sea Sites in Canadian Waters dataset provides spatial and related information of at-sea disposal sites approved for use in Canada in the last ten years and that remain open for consideration for additional use. Any additional use of a disposal site must be conducted in accordance with the terms and conditions of a valid Disposal at Sea permit. The dataset may be of use in relation to Disposal at Sea permit applications. For some Disposal at Sea permit applications the data may be of use in assessing serious harm to fish under the Fisheries Act and assessing interference with navigation under the Navigation Protection Act.
-
The Ice Thickness Program Collection contains ice thickness and snow depth measurements for 11 sites. Measurements are taken at approximately the same location every year on a weekly basis, starting after freeze-up when the ice is safe to walk on, and continuing until break-up or when the ice becomes unsafe. The location is selected close to shore, but over a depth of water which will exceed the maximum ice thickness.
-
Archived population trend estimates, based on data collected through the North American Breeding Bird Survey (BBS), for approximately 300 Canadian bird species. These archived estimates use data from Canadian BBS routes only, collected from 1970 through 2011. Trends are presented for species, provinces, territories, Bird Conservation Regions (BCR), as well as the sub-regions that make up the analytical strata (intersections of BCRs and provinces/territories), for which there are sufficient BBS data for statistical analysis. These estimates were produced using a hierarchical Bayesian model, which differs from the maximum likelihood model that was used to generate BBS trend estimates from 2002 through 2009. Further details on the statistical methods used to produce these estimates is available in the downloadable word documents. The BBS is jointly coordinated by Environment Canada, Canadian Wildlife Service and the U.S. Geological Survey (USGS), Patuxent Wildlife Research Center. Any use of these BBS results for Canada should acknowledge the hundreds of skilled volunteers in Canada who have participated in the BBS over the years and those who have served as provincial or territorial coordinators for the BBS.