
RI_543
Type of resources
Topics
Keywords
Contact for the resource
Provided by
Years
Formats
Representation types
Update frequencies
status
-
This database contains detailed information on various sorbents (materials used to absorb chemicals) with a particular emphasis on the compunds abilities to absorb oil from tanker spills.
-
The Emergencies Science Division of ESTC provides Spills Technology Databases including Brochures, Oil Properties, Chemical Synonyms, PPA Instruments and Tanker Spills. This database contains information on the properties of various types of oils, a chemical thesaurus where one can look up synonymous chemical names, and information on over 700 tanker spills
-
As part of a scientific assessment of critical habitat for boreal woodland caribou (Environment Canada 2011, see full reference in accompanying documentation), Environment Canada's Landscape Science and Technology Division was tasked with providing detailed anthropogenic disturbance mapping, across known caribou ranges, as of 2015. This data comprises a 5-year update to the mapping of 2008-2010 disturbances, and allows researchers to better understand the attributes that have a known effect on caribou population persistence. The original disturbance mapping was based on 30-metre resolution Landsat-5 imagery from 2008 -2010. The mapping process used in 2010 was repeated using 2015 Landsat imagery to create a nationally consistent, reliable and repeatable geospatial dataset that followed a common methodology. The methods developed were focused on mapping disturbances at a specific point of time, and were not designed to identify the age of disturbances, which can be of particular interest for disturbances that can be considered non-permanent, for example cutblocks. The resultant datasets were used for a caribou resource selection function (habitat modeling) and to assess overall disturbance levels on each caribou ranges. Anthropogenic disturbances within 51 caribou ranges across Canada were mapped. The ranges were defined by individual provinces and territories across Canada. Disturbances were remapped across these ranges using 2015 Landsat-8 satellite imagery to provide the most up-to-date data possible. As with the 2010 mapping project, anthropogenic disturbance was defined as any human-caused disturbance to the natural landscape that could be visually identified from Landsat imagery with 30-metre multi-band imagery at a viewing scale of 1:50,000. A minimum mapping unit MMU of 2 ha (approximately 22 contiguous 30-metre pixels) was selected. Each disturbance feature type was represented in the database by a line or polygon depending on their geometric description. Polygonal disturbances included: cutblocks, mines, reservoirs, built-up areas, well sites, agriculture, oil and gas facilities, as well as unknown features. Linear disturbances included: roads, railways, powerlines, seismic exploration lines, pipelines, dams, air strips, as well as unknown features. For each type of anthropogenic disturbance, a clear description was established (see Appendix 7.2 of the science assessment) to maintain consistency in identifying the various disturbances in the imagery by the different interpreters. Features were only digitized if they were visible in the Landsat imagery at the prescribed viewing scale. A 2nd interpreter quality-control phase was carried out to ensure high quality, complete and consistent data collection. For this 2015 update an additional, separate higher-resolution database was created by repeating the process using 15-metre panchromatic imagery. For the 30-metre database only, the line and poly data were buffered by a 500-metre radius, representing their extended zone of impact upon boreal caribou herds. Additionally, forest fire polygons were merged into the anthropogenic footprint in order to create an overall disturbance footprint. These buffered datasets were used in the calculation of range disturbance levels and for integrated risk assessment analysis.
-
This collection holds the layers used for the "Map of Upper Intertidal shoreline segmentation with Shoreline Cleanup Assessment Technique (SCAT) classification", a WMS service maintained by ECCC. The segmentation covers shorelines for Northern Canada, the North coast of British Columbia, as well as Ontario, Quebec, and Atlantic regions.
-
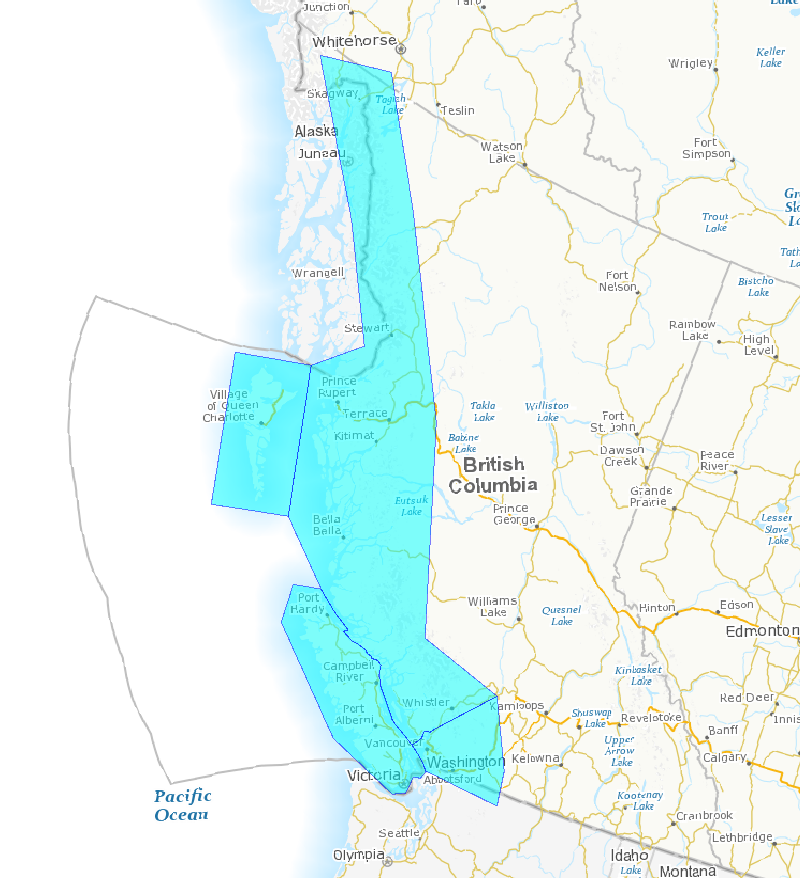
This spatial file includes the polygon boundaries of the four Pacific Great Blue Heron Conservation Regions in British Columbia, as described in the management plan. These Conservation Regions are recognized based on degree of isolation, population sizes, and differences in trends and threats. The management objective for Pacific Great Blue Heron is to ensure that all four Conservation Regions have stable or locally increasing numbers of herons. Refer to the "Management Plan for the Great Blue Heron fannini subspecies (Ardea herodias fannini) in Canada" on the SARA Regristry for more information.
-
In 2006, the Government of Canada initiated the Chemicals Management Plan (CMP), which takes action regarding chemicals that are harmful to human health or the environment. One element of the CMP is Monitoring and Surveillance, which generates data on the presence and levels of chemical substances in environmental matrices. These data are used to make decisions regarding the best approach to protect Canadians and their environment from risks these substances might pose. In support of the CMP, a wastewater monitoring program was initiated in 2009 to generate data on priority substances that may be released to the environment. The wastewater sector has been identified as an important release point to the environment for certain CMP substances. The purpose of the wastewater monitoring program is to gather information from representative municipal wastewater treatment plants (WWTPs) across Canada to determine the levels of selected chemical substances entering WWTPs, the fate of these substances through typical wastewater and sludge treatment processes (primary treatment, activated sludge treatment, lagoon treatment, etc.) at warm and cold process temperatures, and the levels of these substances being discharged in WWTP effluents and solids residuals. The participation of various WWTPs in this program is done on a voluntary and anonymous basis, and sampling commences once a Collaboration Arrangement has been signed by the Municipality and Environment and Climate Change Canada. The results from this monitoring project are used to improve our understanding of the fate of chemical substances during wastewater treatment and to determine if control measures are needed to prevent these substances from entering municipal wastewater systems.
-

This dataset is part of Environment and Climate Change Canada’s Shoreline Classification and Pre-Spill database. Shoreline classification data has been developed for use by the Environmental Emergencies Program of Environment and Climate Change Canada for environmental protection purposes. Marine and freshwater shorelines are classified according to the character (substrate and form) of the upper intertidal (foreshore) or upper swash zone (Sergy, 2008). This is the area where oil from a spill usually becomes stranded and where treatment or cleanup activities take place. The basic parameter that defines the shoreline type is the material that is present in the intertidal zone. The presence or absence of sediments is a key factor in determining whether oil is stranded on the surface of a substrate or can penetrate and/or be buried. This dataset contains thousands of linear shoreline segments ranging in length from 200 m and 2 km long. The entities represent the location of the segments and their geomorphological description. There exist further fields in the attribute table for this dataset. We are currently working on standardizing our shoreline segmentation datasets and the updated data will soon be uploaded to the catalog. Sergy, G. (2008). The Shoreline Classification Scheme for SCAT and Oil Spill Response in Canada. Proceedings of the 31stArctic and Marine Oil Spill Program Technical Seminar.Environment Canada, Ottawa, ON, Pp. 811-819.
-
The Water Survey of Canada (WSC) is the national authority responsible for the collection, interpretation and dissemination of standardized water resource data and information in Canada. In partnership with the provinces, territories and other agencies, WSC operates over 2800 active hydrometric gauges across the country. WSC maintains and provides real-time and historic hydrometric data for some 8000 active and discontinued stations. This dataset consists of a set of polygons that represent the drainage areas of both active and discontinued discharge stations. Users are encouraged to report any errors using the “Contact Us” webpage at: https://weather.gc.ca/mainmenu/contact_us_e.html?site=water
-

This dataset is part of Environment and Climate Change Canada’s Shoreline Classification and Pre-Spill database and it covers various locations across the Canadian Arctic i.e. James Bay, Resolute Bay and the south coast of Devon Island, the south-west coast of Hudson Bay, Labrador Coast, Victoria Strait, Beaufort Sea, and the North-east coast of Baffin Island. Shoreline classification data has been developed for use by the Environmental Emergencies Program of Environment and Climate Change Canada for environmental protection purposes. Marine and freshwater shorelines are classified according to the character of the upper intertidal (foreshore) or upper swash zone. This is the area where oil from a spill usually becomes stranded and where the treatment or cleanup activities take place. The basic parameter that defines the shoreline type is the material that is present in the intertidal zone. The presence or absence of sediments is a key factor in determining whether oil is stranded on the surface of a substrate or can penetrate and/or be buried. This dataset contains thousands of linear shoreline segments ranging in length from 200 m and 2 km long. The entities represent the location of the segments and their geomorphological description. There exist further fields in the attribute table for this dataset. We are currently working on standardizing our shoreline segmentation datasets and the updated data will soon be uploaded to the catalog. Sergy, G. (2008). The Shoreline Classification Scheme for SCAT and Oil Spill Response in Canada. Proceedings of the 31stArctic and Marine Oil Spill Program Technical Seminar.Environment Canada, Ottawa, ON, Pp. 811-819.
-
As part of research projects in Environment and Climate Change Canada, historical physical limnology observations have been collected in Canadian Lakes since 1968. These observations include one or more concurrent measurements of water temperature profiles, directional velocities (east-west and north-south directions) profiles, conductivity, turbidity, and dissolved oxygen at different depths, in Lake Erie, Lake Ontario, Lake Huron, Georgian Bay, and Lake Winnipeg. These observations are in raw (original) and organized formats. The organized observations have gone through basic QA/QC processing steps (e.g., excluding air-water periods or anomalies in the records). Both raw and organized observations are shared here.