
series
Type of resources
Topics
Keywords
Contact for the resource
Provided by
Years
Formats
Representation types
Update frequencies
status
-

This dataset provides marine bacteriological water quality data for bivalve shellfish harvest areas in Canada (British Columbia, New Brunswick, Newfoundland and Labrador, Nova Scotia, Prince Edward Island and Quebec). Shellfish harvest area water temperature and salinity data are also provided as adjuncts to the interpretation of fecal coliform density data. The latter is the indicator of fecal matter contamination monitored annually by Environment and Climate Change Canada (ECCC) within the framework of the Canadian Shellfish Sanitation Program (CSSP). The geospatial positions of the sampling sites are also provided. These data are collected by ECCC for the purpose of making recommendations on the classification of shellfish harvest area waters. ECCC recommendations are reviewed and adopted by Regional Interdepartmental Shellfish Committees prior to regulatory implementation by Fisheries and Oceans Canada (DFO).
-
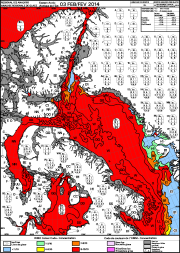
These ice charts illustrate ice conditions at a particular moment in time. The ice information is presented using a standard international code, known as the Egg Code. The following charts are available from the Canadian Ice Service: -Daily Ice Charts -Image Analysis Ice Charts -Regional Ice Charts
-
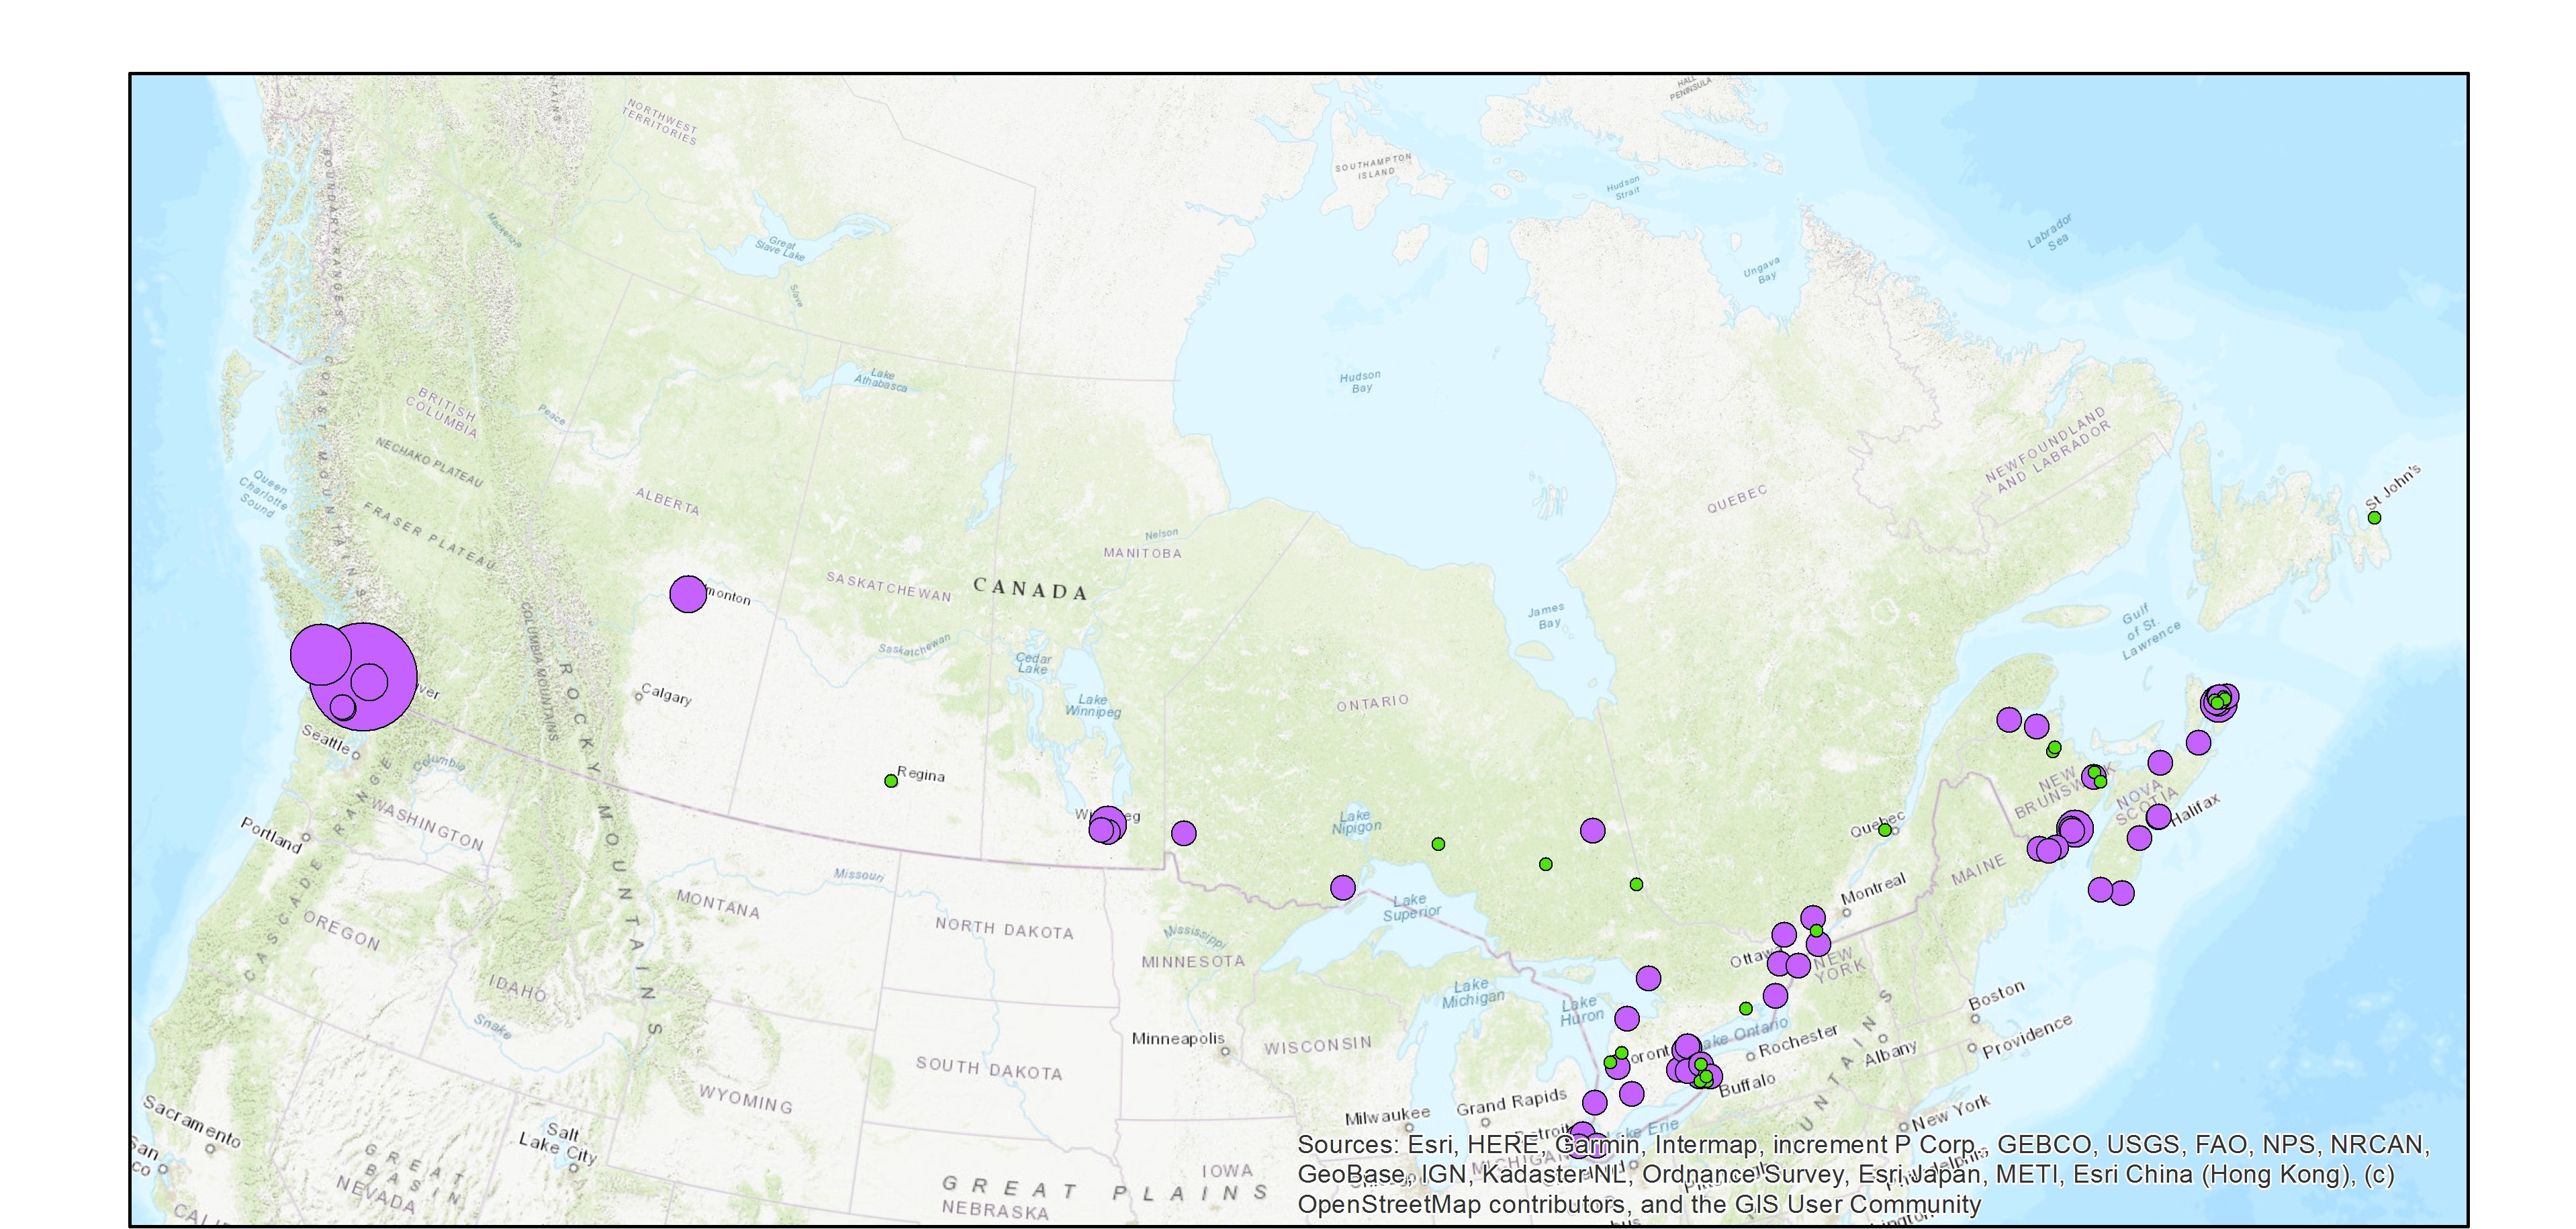
The Wastewater Systems Effluent Regulations (WSER), developed under the Fisheries Act, came into force in 2012 to manage wastewater releases by systems that collect an average daily influent volume of 100 cubic metres or more. The WSER also does not apply to any wastewater system located in the Northwest Territories, Nunavut and north of the 54th parallel in the provinces of Quebec and Newfoundland and Labrador. The WSER set national baseline effluent quality standards that are achievable through secondary wastewater treatment. The WSER require owners or operators of wastewater systems with combined sewers to submit an annual report on the total volume and the number of days wastewater is discharged per month via combined sewer overflow (CSO) points as a result of precipitation. The map below shows the volume of effluent (in cubic metres) discharged in a year from all CSO points situated within the collection area of a wastewater system. For the most part, the volumes provided to ECCC are estimates. Please note, a value of “999999999” in the dataset indicates that the volume data is unavailable and it does not mean that a volume of 999,999,999 m3 was released within the collection area of a wastewater system. The map is available in both ESRI REST (to use with ARC GIS) and WMS (open source) formats. For more information about the individual reporting wastewater systems, datasets are available in either CSV or XLS formats. Data from Quebec As of 2018, no combined sewer overflow volumes from Quebec municipalities are available since an equivalency agreement is now in effect. More information on the wastewater sector including the regulations, agreements, contacts and resource documents is available at: https://www.canada.ca/wastewater
-
Water level and discharge data are available from Water Survey of Canada’s Hydrometric Network. The Water Survey of Canada (WSC) is the national authority responsible for the collection, interpretation and dissemination of standardized water resource data and information in Canada. In partnership with the provinces, territories and other agencies, WSC operates over 2500 active hydrometric gauges across the country, maintains an archive of historical information for over 7600 stations and provides access to near real-time (water level and stream flow) provisional data at over 1700 locations in Canada.
-

This dataset provides geospatial polygon boundaries for marine bivalve shellfish harvest area classification in Canada (British Columbia, New Brunswick, Newfoundland and Labrador, Nova Scotia, Prince Edward Island and Quebec). These data represent the five classification categories of marine bivalve shellfish harvest areas (Approved; Conditionally Approved; Restricted; Conditionally Restricted; and Prohibited) under the Canadian Shellfish Sanitation Program (CSSP). Data are collected by Environment and Climate Change Canada (ECCC) for the purpose of making applicable classification recommendations on the basis of sanitary and water quality survey results. ECCC recommendations are reviewed and adopted by Regional Interdepartmental Shellfish Committees prior to regulatory implementation by Fisheries and Oceans Canada (DFO). These geographic data are for illustrative purposes only; they show shellfish harvest area classifications when in Open Status. The classification may be superseded at any time by regulatory orders issued by DFO, which place areas in Closed Status, due to conditions such as sewage overflows or elevated biotoxin levels. For further information about the current status and boundary coordinates for areas under Prohibition Order, please contact your local DFO office.
-
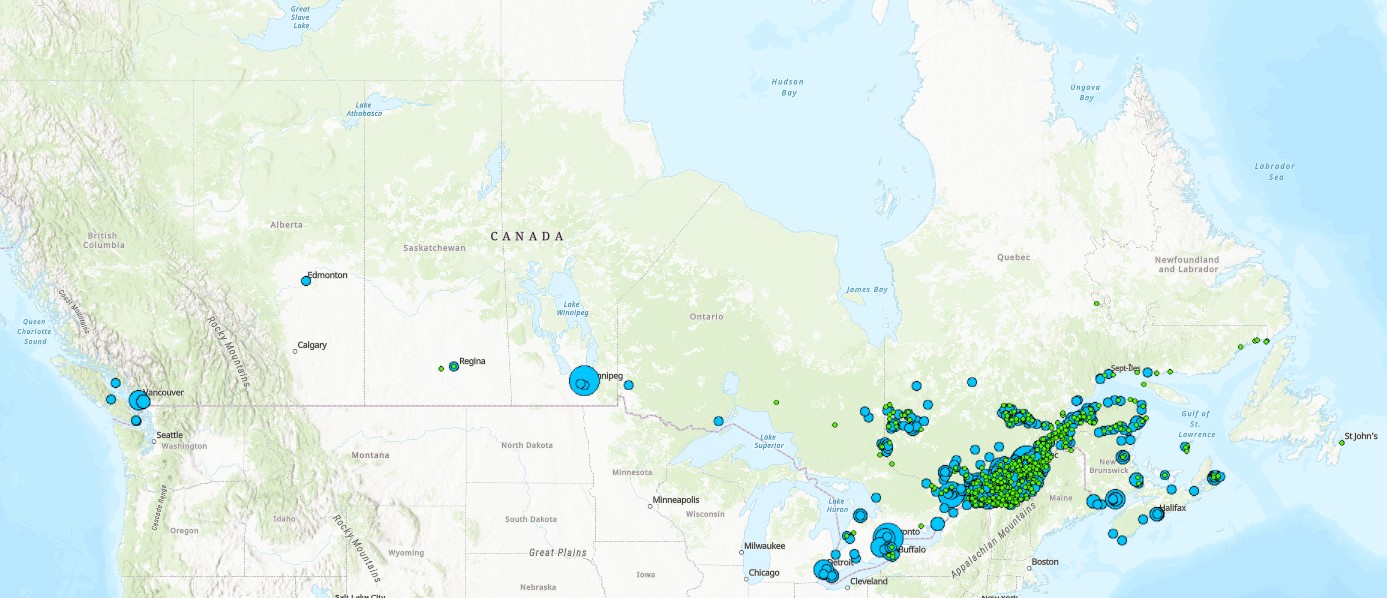
The Wastewater Systems Effluent Regulations (WSER), developed under the Fisheries Act, came into force in 2012 to manage wastewater releases by systems that collect an average daily influent volume of 100 cubic metres or more. The WSER also does not apply to any wastewater system located in the Northwest Territories, Nunavut and north of the 54th parallel in the provinces of Quebec and Newfoundland and Labrador. The WSER set national baseline effluent quality standards that are achievable through secondary wastewater treatment. The province of Quebec provided some combined sewer overflow data for 2020, which includes information on whether a discharge occurred at a combined sewer overflow point during the year. The map below shows the number of CSO points with at least one overflow event within each wastewater system. The map is available in both ESRI REST (to use with ARC GIS) and WMS (open source) formats. For more information about the individual reporting wastewater systems, datasets are available in either CSV or XLS formats. More information on the wastewater sector including the regulations, agreements, contacts and resource documents is available at: https://www.canada.ca/wastewater
-
Since 1988, the governments of Canada and Quebec have been working together to conserve, restore, protect and develop the St. Lawrence River under the St. Lawrence Action Plan (SLAP). One of the projects identified under the theme of biodiversity conservation is the development of an integrated plan for the conservation of the natural environments and biodiversity of the St. Lawrence River. The identification of priority sites for conservation has been the first step of this planning exercise. Conservation planning of natural environments requires a reliable, accurate and up-to-date image of the spatial distribution of ecosystems in the study area. In order to produce an Atlas of Priority Sites for Conservation in the St. Lawrence Lowlands, an updated cartography of the land cover of this vast territory was undertaken. This project required obtaining reliable information on the natural environments of the St. Lawrence Lowlands. Although several land cover mapping projects have been conducted for specific types of habitats, it was particularly important to obtain a homogeneous product that would cover the entire territory and that would provide the most detailed information on its various thematic components: agricultural, aquatic, human-modified and forest environments, wetlands as well as old fields and bare ground. The methodology used to produce the land cover mapping of the St. Lawrence Lowlands thus relied mainly on combining and enhancing the best existing products for each theme. This project was made in collaboration with MDDELCC as part of the St. Lawrence Action Plan (SLAP).
-
Canada has the longest coastline in the world, measuring 243,790 kilometers. Many of our waterways along the coastline have to be dredged regularly to keep shipping channels and harbours open and safe for navigation; and this material is sometimes best disposed of at sea. Schedule 5 of the Canadian Environmental Protection Act, 1999 (CEPA) defines an exclusive list of materials and substances suitable for disposal at sea in Canada, which is in accordance with the London Protocol (1996). They are: dredged material, fish waste resulting from industrial fish processing operations, ships or platforms, inert and inorganic geological matter, uncontaminated organic matter of natural origin, and bulky substances. The disposal of any substance into the sea, on the seabed, in the subsoil of the seabed, or onto ice, from a ship, an aircraft, a platform or other structure is not allowed unless a permit is issued by the Environment and Climate Change Canada (ECCC) Disposal at Sea Program. Incineration at sea, as well as importing or exporting a substance for disposal at sea is also prohibited. More information on Disposal at Sea is available at: https://www.canada.ca/en/environment-climate-change/services/disposal-at-sea.html The Active and Inactive Disposal at Sea Sites in Canadian Waters dataset provides spatial and related information of at-sea disposal sites approved for use in Canada in the last ten years and that remain open for consideration for additional use. Any additional use of a disposal site must be conducted in accordance with the terms and conditions of a valid Disposal at Sea permit. The dataset may be of use in relation to Disposal at Sea permit applications. For some Disposal at Sea permit applications the data may be of use in assessing serious harm to fish under the Fisheries Act and assessing interference with navigation under the Navigation Protection Act.
-
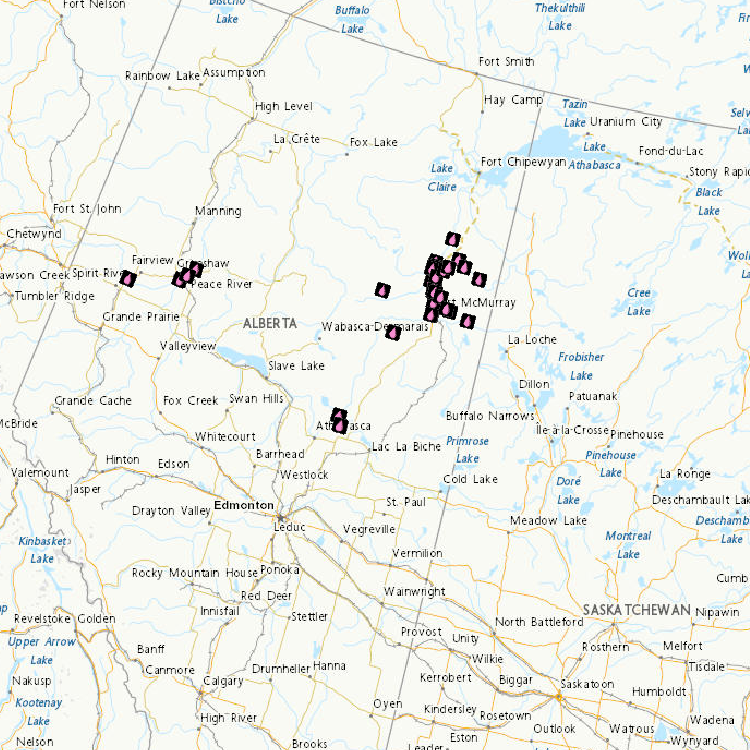
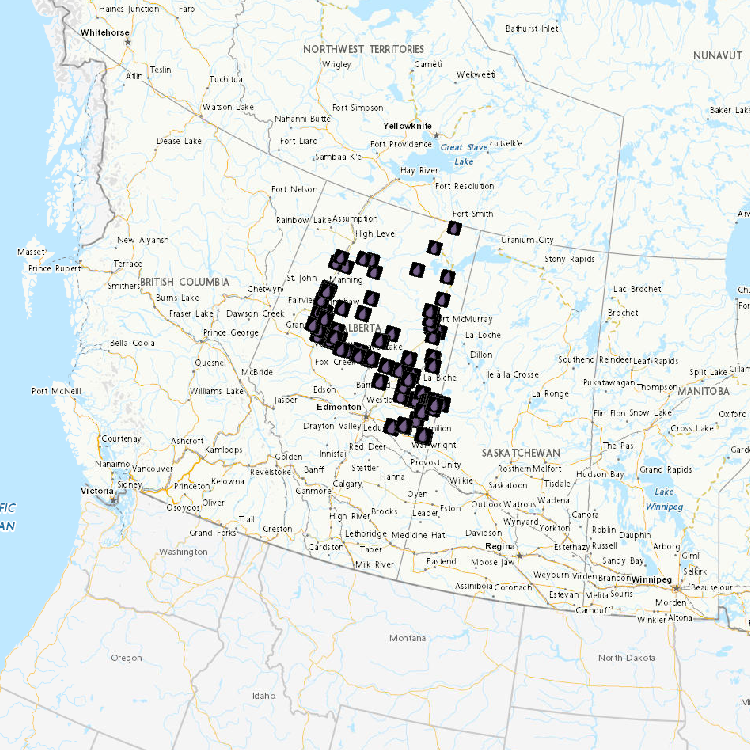
The objectives of the fish component of the integrated oil sands monitoring program are to provide the necessary data/information to address key questions related to both environmental health of fish populations and fish health issues that can be used to inform human use and consumption. The questions underlying the fish monitoring design are related to the status and health of wild fish populations in the Lower Athabasca River including and in an expanded geographical extent. Data is being collected to provide a baseline against which future changes in fish populations will be evaluated, and compared to data from historical studies to assess change over time to the current state. Data is also being collected in areas of new oil sands development, to develop baseline data for future site-specific comparisons, contribute to an expanded geographic basis of the overall monitoring plan, and contribute to an improved ability to examine cumulative effects.
-
Habitat and ecosystem data used to conduct a baseline survey of coastal habitat in Lake Huron, Georgian Bay, and St. Marys River are included in this dataset. The Lake Huron Survey methodology consists of four general steps; 1) delineating the coastal ecosystem into coastal units based on water flow, ecology, and geology; 2) selecting key habitat types including wetlands, uplands (natural and anthropogenic), tributaries, and inland lakes and ponds, and the measures to assess each habitat type and the entire coastal ecosystem; 3) conducting a spatial analysis and summarizing results; and 4) sharing results.