
2011
Type of resources
Topics
Keywords
Contact for the resource
Provided by
Years
Formats
Representation types
Update frequencies
status
-
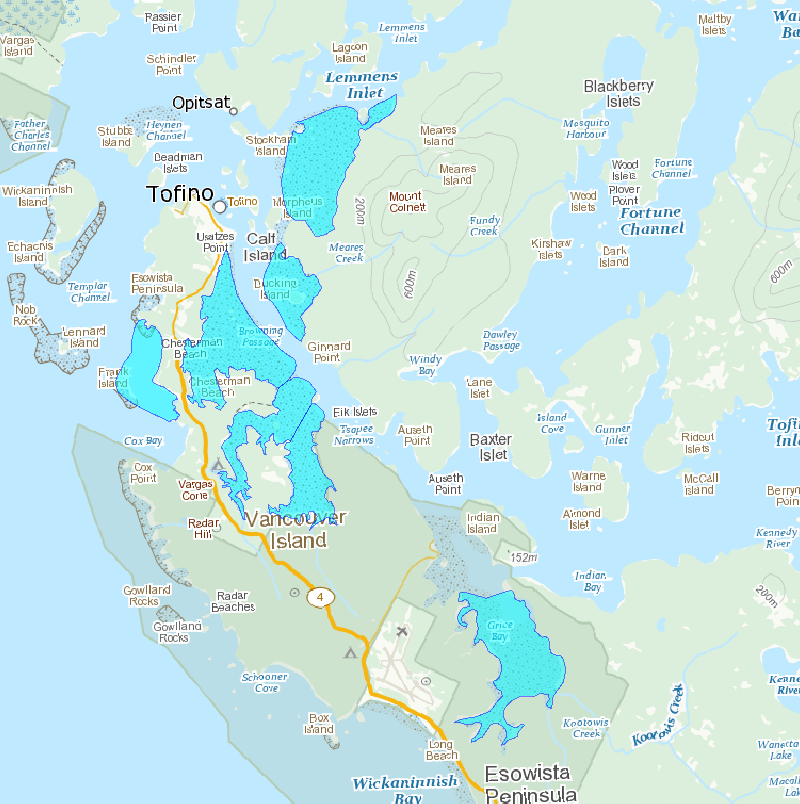
Survey areas is a polygon feature class containing mudflats and staging areas observed for shorebirds.
-
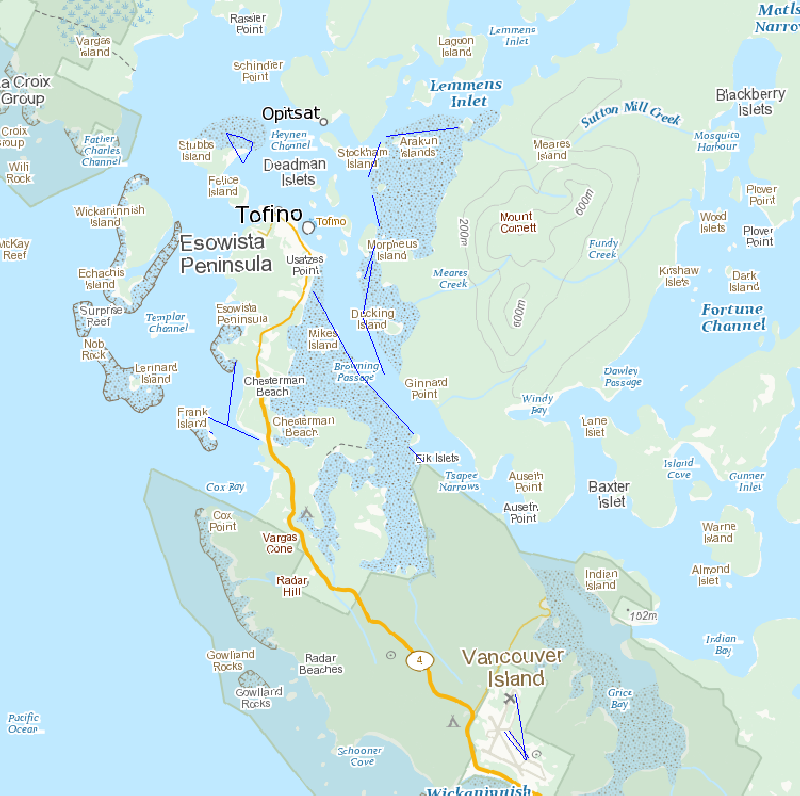
Survey transects is a line feature class containing transects completed in 2011.
-
These shorebird surveys are conducted intermittently at a series of sites near the town of Tofino on the west coast of Vancouver Island, British Columbia, during northward (April to May) and southward migration (July to November). This survey includes all shorebird species. Surveyors used binoculars or a spotting scope to count the total number of shorebirds present within the natural boundaries of each survey site during the northward and/or southward migration periods. They used a boat to count birds within the entire area of Arakun Flats and Ducking Flats by traveling along the outer edge of the mudflats, and by stopping at standardized vantage points on land. They also used a boat to view as much area as possible within Maltby Slough, South Bay and Grice Bay from the openings to each of these bays. Surveyors walked the entire length of Chesterman Beach including the tombolo to Frank Island. Surveys were done at least twice a week at each site. Most boat surveys began at low tide when the mudflats were exposed and continued on the rising tide. Road accessible sites were usually surveyed during the hour before high tide or at high tide in 2011. Surveys were not conducted in weather that reduced visibility or made boat travel unsafe (heavy rain or high wind). Surveyors counted birds individually when they were within flocks of fewer than 200 birds. They estimated the size of larger flocks by counting 50 or 100 birds and then judged how many similar-sized groups made up the entire flock. Distant flocks were recorded as small or large shorebirds and assumed to have the same species composition as those closer to shore in 1995 or identified to species group and recorded as either “dowitchers” or “peeps” in 2011.
-
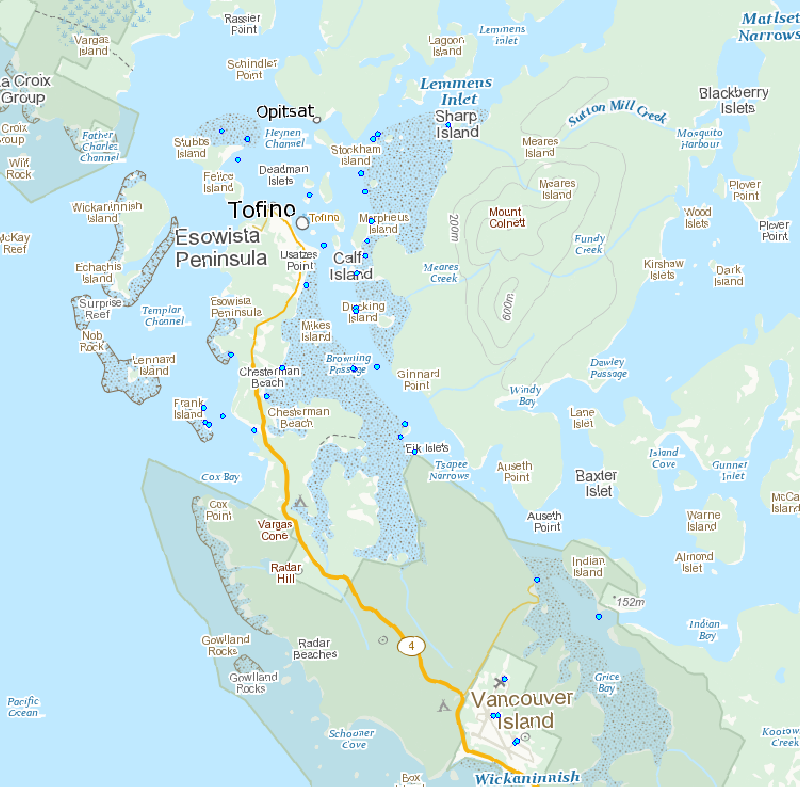
Survey points is a point feature class containing transects and observations completed in 2011.
-
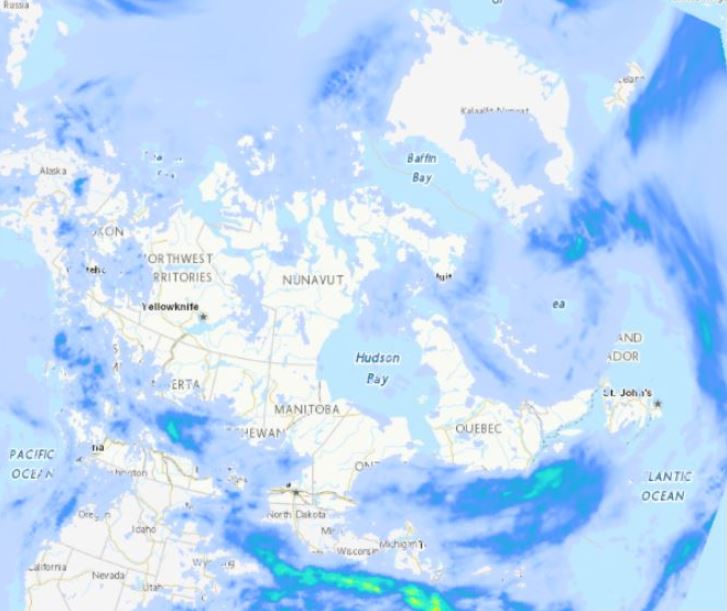
The Regional Deterministic Precipitation Analysis (RDPA) produces a best estimate of precipitation amounts that occurred over a period of 24 hours. The estimate integrates data from in situ precipitation gauge measurements, weather radar, satellite imagery and numerical weather prediction models. Geographic coverage is North America (Canada, United States and Mexico). Data is available at a horizontal resolution of 10 km. The 24 hour analysis is produced twice a day and is valid at 06 and 12 UTC. A preliminary analysis is available approximately 1 hour after the end of the accumulation period and a final one is generated 7 hours later in order to assimilate more gauge data.
-
In 2011-2014 samples of groundwater and septic wastewater were sampled from various sites in Ontario, Canada. Most of the groundwater sites were impacted by septic wastewater plumes. The samples were analyzed for four artificial sweeteners (acesulfame, saccharin, cyclamate, sucralose), perchlorate, six anionic pesticides (glyphosate, 2,4-D, glufosinate, fosamine, MCPA, picloram) and a metabolite of glyphosate (AMPA).
-
The Canadian Environmental Sustainability Indicators (CESI) program provides data and information to track Canada's performance on key environmental sustainability issues. The water quality indicators measure water conditions for various locations across Canada. It combines measurements of a wide range of substances found in water samples. The indicator focuses on how suitable the water is for plants and animals; aquatic life is present in all water bodies, is sensitive to pollution, and reflects the overall health of aquatic ecosystems. Information is provided to Canadians in a number of formats including: static and interactive maps, charts and graphs, HTML and CSV data tables and downloadable reports. See the supplementary documentation for data sources and details on how those data were collected and how the indicator was calculated.
-
This data set contains concentrations of triclosan in wastewater Influent (INF), Effluent (EFF), Landfill Leachate (LCH), Biosolids (BIOS) and Sludge (SLG) sampled from various Wastewater Treatment Plants (WWTP's) and Landfills across Canada.
-
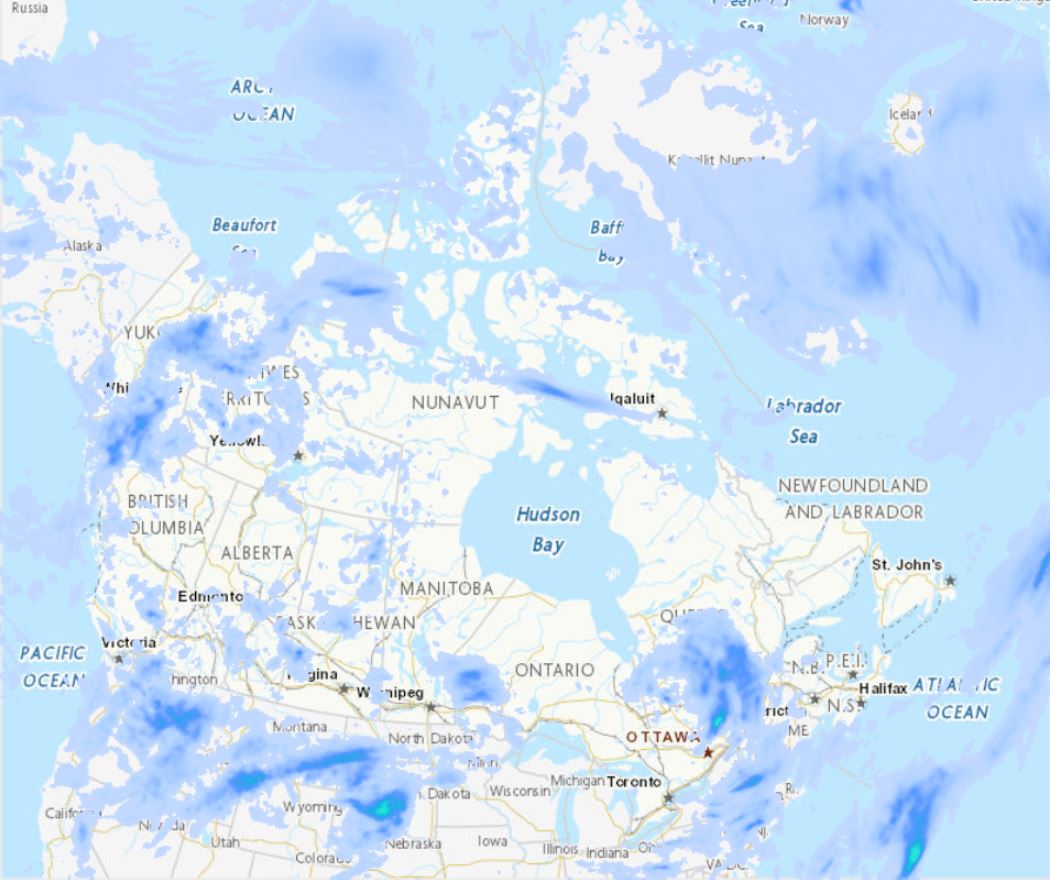
The Regional Deterministic Precipitation Analysis (RDPA) produces a best estimate of the amount of precipitation that occurred over recent past periods of 6 or 24 hours. The estimate integrates data from in situ precipitation gauge measurements, weather radar, satellite imagery and numerical weather prediction models. Geographic coverage is North America (Canada, United States and Mexico). Data is available at horizontal resolution of 10 km. Data is only available for the surface level. Analysis data is made available four times a day for 6h intervals and twice a day for the 24h interval. A preliminary estimate is available approximately 1h after the end of the accumulation period, and revised 7h after in order to assimilate gauge data arriving later.
-
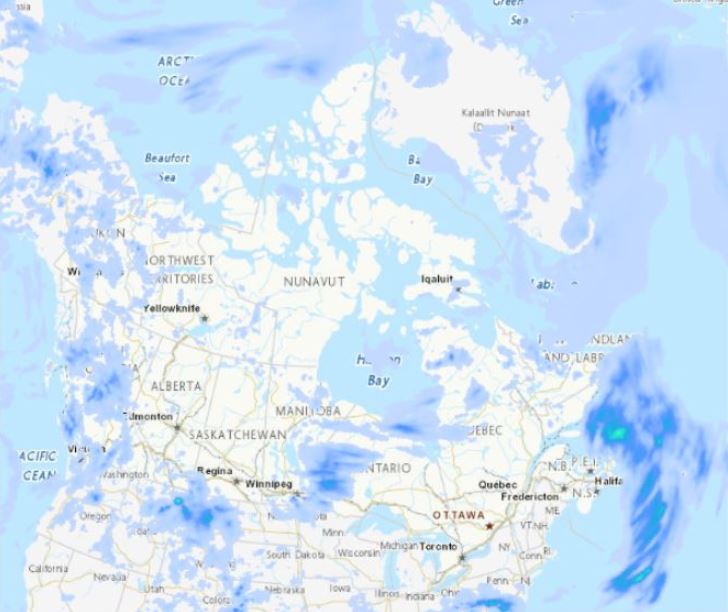
The Regional Deterministic Precipitation Analysis (RDPA) produces a best estimate of precipitation amounts that occurred over a period of 6 hours. The estimate integrates data from in situ precipitation gauge measurements, weather radar, satellite imagery and numerical weather prediction models. Geographic coverage is North America (Canada, United States and Mexico). Data is available at a horizontal resolution of 10 km. The 6 hour analysis is produced 4 times a day and is valid at 00, 06, 12 and 18 UTC. A preliminary analysis is available approximately 1 hour after the end of the accumulation period and a final one is generated 7 hours later in order to assimilate more gauge data.