
Society
Type of resources
Topics
Keywords
Contact for the resource
Provided by
Years
Formats
Representation types
Update frequencies
status
-
The Canadian Environmental Sustainability Indicators (CESI) program provides data and information to track Canada's performance on key environmental sustainability issues. The Pulp and paper effluent quality indicator reports the percentage of acute lethality, biochemical oxygen demand and total suspended solid tests that are within the regulatory limits for selected years between 1985 and 2020. The purpose of the Pulp and Paper Effluent Regulations is to manage threats to fish, fish habitat, and human health from fish consumption by limiting the deposit of deleterious substances from pulp and paper mills into water frequented by fish. Ensuring that pulp and paper mill operators meet environmental protection standards helps to protect our aquatic environment for future generations. Information is provided to Canadians in a number of formats including: static and interactive maps, charts and graphs, HTML and CSV data tables and downloadable reports. See the supplementary documentation for the data sources and details on how the data were collected and how the indicator was calculated. Canadian Environmental Sustainability Indicators: https://www.canada.ca/environmental-indicators
-

The Canadian Environmental Sustainability Indicators (CESI) program provides data and information to track Canada's performance on key environmental sustainability issues. The Releases of harmful substances to water indicator tracks facility-based releases to water of 3 substances that are defined as toxic under the Canadian Environmental Protection Act, 1999: mercury, lead and cadmium and their compounds. For each substance, data are provided at the national, regional (provincial and territorial) and facility level and by source. Mercury and its compounds, lead and inorganic cadmium compounds are on the Toxic substances list under Schedule 1 of the Canadian Environmental Protection Act, 1999. This means that these substances are "entering or may enter the environment in a quantity or concentration or under conditions that (a) have or may have an immediate or long-term harmful effect on the environment or its biological diversity; (b) constitute or may constitute a danger to the environment on which life depends; or (c) constitute or may constitute a danger in Canada to human life or health." The indicators inform Canadians about releases to water of these 3 substances from facilities in Canada. The Releases of harmful substances to water indicators also help the government to identify priorities and develop or revise strategies to inform further risk management and to track progress on policies put in place to reduce or control these 3 substances and water pollution in general. Information is provided to Canadians in a number of formats including: static and interactive maps, charts and graphs, HTML and CSV data tables and downloadable reports. See the supplementary documentation for the data sources and details on how the data were collected and how the indicator was calculated. Canadian Environmental Sustainability Indicators: https://www.canada.ca/environmental-indicators
-
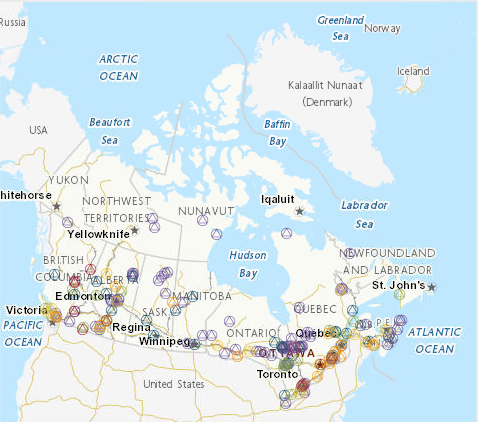
"The Canadian Environmental Sustainability Indicators (CESI) program provides data and information to track Canada's performance on key environmental sustainability issues. The Air pollutant emissions indicators track emissions from human activities of 6 key air pollutants: sulphur oxides, nitrogen oxides, volatile organic compounds, ammonia, carbon monoxide and fine particulate matter. Black carbon, which is a component of fine particulate matter, is also reported. Sectoral indicators on air pollutant emissions from transportation, off-road vehicles and mobile equipment, electric utilities and the oil and gas industry provide additional analysis on the largest sources of Canada's air pollutant emissions. For each air pollutant, the indicators are provided at the national and provincial/territorial levels. They also identify the major sources of emissions and provide links to detailed information on air pollutant emissions from facilities. The Air pollutant emissions indicators are intended to inform Canadians and decision makers about progress made towards reducing emissions from human-related sources of air pollutants and about the effectiveness of emission reduction measures implemented to improve ambient air quality in Canada. Information is provided to Canadians in a number of formats including: static and interactive maps, charts and graphs, HTML and CSV data tables and downloadable reports. See the supplementary documentation for the data sources and details on how the data were collected and how the indicator was calculated. Canadian Environmental Sustainability Indicators: https://www.canada.ca/environmental-indicators
-
The Canadian Environmental Sustainability Indicators (CESI) program provides data and information to track Canada's performance on key environmental sustainability issues. If unsafe bacterial levels are measured in water samples or if shoreline surveys identify pollution concerns, Environment and Climate Change Canada makes water classification recommendations to its Canadian Shellfish Sanitation Program partners. Fisheries and Oceans Canada opens or closes shellfish harvest areas based on those recommendations. While elements of program operations and implementation have some impact on the results, the indicators track the proportion of shellfish harvest areas that have their water quality classified as approved or conditionally approved and the proportion of samples with fecal coliform levels less than 43 most probable number (MPN) per 100 mL as a coarse measure of the quality of marine coastal water. Information is provided to Canadians in a number of formats including: static and interactive maps, charts and graphs, HTML and CSV data tables and downloadable reports. See the supplementary documentation for the data sources and details on how the data were collected and how the indicator was calculated. Canadian Environmental Sustainability Indicators: https://www.canada.ca/environmental-indicators
-
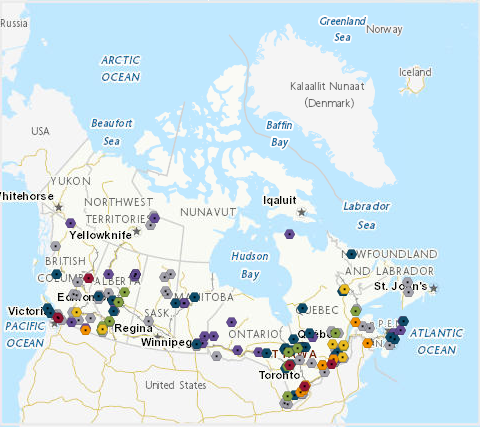
The Canadian Environmental Sustainability Indicators (CESI) program provides data and information to track Canada's performance on key environmental sustainability issues. The Releases of harmful substances to water indicators track facility-based releases to water of 3 substances that are defined as toxic under the Canadian Environmental Protection Act, 1999: mercury, lead and cadmium and their compounds. For each substance, data are provided at the national, regional (provincial and territorial) and facility level and by source. The indicators inform Canadians about releases to water of these 3 substances from facilities in Canada. The Releases of harmful substances to water indicators also help the government to identify priorities and develop or revise strategies to inform further risk management and to track progress on policies put in place to reduce or control these 3 substances and water pollution in general. Information is provided to Canadians in a number of formats including: static and interactive maps, charts and graphs, HTML and CSV data tables and downloadable reports. See the supplementary documentation for the data sources and details on how the data were collected and how the indicator was calculated. Canadian Environmental Sustainability Indicators: https://www.canada.ca/environmental-indicators
-
The Canadian Environmental Sustainability Indicators (CESI) program provides data and information to track Canada's performance on key environmental sustainability issues. The Releases of harmful substances to water indicators track facility-based releases to water of 3 substances that are defined as toxic under the Canadian Environmental Protection Act, 1999: mercury, lead and cadmium and their compounds. For each substance, data are provided at the national, regional (provincial and territorial) and facility level and by source. The indicators inform Canadians about releases to water of these 3 substances from facilities in Canada. The Releases of harmful substances to water indicators also help the government to identify priorities and develop or revise strategies to inform further risk management and to track progress on policies put in place to reduce or control these 3 substances and water pollution in general. Information is provided to Canadians in a number of formats including: static and interactive maps, charts and graphs, HTML and CSV data tables and downloadable reports. See the supplementary documentation for the data sources and details on how the data were collected and how the indicator was calculated. Canadian Environmental Sustainability Indicators: https://www.canada.ca/environmental-indicators