
Environment
Type of resources
Topics
Keywords
Contact for the resource
Provided by
Years
Formats
Representation types
Update frequencies
status
-
With the changing climate conditions, marine traffic along Canada’s coastal regions has increased over the past couple of decades and the need to improve our state of preparedness for oil-spill-related emergencies is critical. Baseline coastal information, such as shoreline form, substrate, and vegetation type, is required for prioritizing operations, coordinating onsite spill response activities (i.e. Shoreline Cleanup Assessment Technique [SCAT]), and providing information for wildlife and ecosystem management. Between 2010 and 2017, georeferenced high-definition videography and photos were collected for various study sites across coastal Canada. The study areas include Beaufort Sea, Mackenzie Delta channels and Banks Island in the western Canadian Arctic; James Bay, Hudson Bay, Nunavik, Resolute Bay, Victoria Strait, Baffin Island and Coronation Gulf in the eastern Canadian Arctic; Labrador, Bay of Fundy and Chedabucto Bay in Atlantic Canada and Kitimat, Haida Gwaii and Burrard Inlet in the northern Pacific. Data was collected during ice-free and low tide conditions (where applicable) between July and September. Low-altitude helicopter surveys were conducted at each study site to capture video of the shoreline characteristics. In addition to acquiring videography, ground-based observations were recorded in several locations for validation. Shoreline segmentation was then carried out by manual interpretation of the oblique videography and the photos aided by ancillary data. This involved splitting and classifying the shoreline vectors based on homogeneity of the upper intertidal zone. Detailed geomorphological information (i.e. shoreline type, substrate, slope, height, accessibility etc.) describing the upper intertidal, lower intertidal, supratidal and backshore zones was extracted from the video and entered into a geospatial database using a customized data collection form. In addition, biological characteristics like biobands, water features, fauna, human use etc. observed along the coast were recorded. The data was also validated through ground samples (when available) and a second interpreter QA (quality analysis) was performed on each dataset (excluding Nunavik) to ensure high quality and consistency. The final dataset contains segments ranging in length from 150 metres to 2500 metres. In total, from 2010 to 2017, within the 14 study sites, about 26,150 km of shoreline were mapped.
-
The datasets and maps are associated with a research study. Annual total (dry + wet) deposition fluxes of nitrogen (nitric acid, nitrate and ammonium) and sulfur (sulfur dioxide and sulfate) were determined at 15 Canadian Air and Precipitation Monitoring Network (CAPMoN) sites from 2000 to 2018. The sites are located in the west coast, prairies, central and southern Ontario and Quebec, eastern Quebec, and Atlantic Canada. Dry deposition fluxes were estimated using the ambient air concentrations and dry deposition velocities of nitrogen and sulfur compounds. Monitored ambient air concentrations are available from CAPMoN’s Air Filter Pack data, and dry deposition velocities were estimated using ECCC’s Global Environmental Multiscale (GEM) model and Moderate Resolution Imaging Spectroradiometer (MODIS) land use data and leaf area index. Monitored wet deposition fluxes were determined using CAPMoN’s Precipitation Chemistry data and precipitation depth. To evaluate whether acidic deposition exceeded critical loads and assess potential ecosystem effects, aquatic and terrestrial critical loads of acidity were estimated using the Steady-State Water Chemistry and Simple Mass Balance models, respectively, and geospatial tools were used to extract the critical loads data surrounding the CAPMoN sites.
-
Communities in east Hudson Bay and James Bay are concerned about ecosystem changes observed in recent decades, particularly related to sea-ice conditions, and also about potential impacts of contaminants from long-range atmospheric transport and regional human activities. The Arctic Eider Society’s Community-Driven Research Network (CDRN) was established to measure and better understand large-scale cumulative environmental impacts in east Hudson Bay and James Bay. Building on CDRN collaborations and activities in five communities (Sanikiluaq, Kuujjuaraapik, Inukjuak, Umiujaq, Chisasibi), this Northern Contaminants Program (NCP) community-based project generated new information on metal bioaccumulation that provide a regionally integrated perspective on metal exposure in the marine environment of east Hudson Bay and James Bay.
-
Information received in response to notices published in the Canada Gazette under section 71 of the Canadian Environmental Protection Act (CEPA 1999). These notices target chemical substances of interest under the Chemicals Management Plan.
-
Long-term freshwater quality monitoring data for Rainy River / Lake of the Woods Watershed for the past 15 years or longer for nutrients, metals, major ions, and other physical-chemical variables are included in this dataset. Monitoring is conducted by Environment and Climate Change Canada (ECCC) to assess water quality status and long-term trends, detect emerging issues, establish water quality guidelines and track the effectiveness of remedial measures and regulatory decisions. The information informs and supports the Fresh Water Action Plan.
-
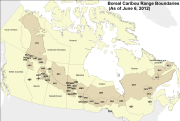
As part of a scientific assessment of critical habitat for boreal woodland caribou (Environment Canada 2011, see full reference in accompanying documentation), Environment Canada's Landscape Science and Technology Division was tasked with providing detailed anthropogenic disturbance mapping across known caribou ranges. This data allowed researchers to better understand the attributes that have a known effect on caribou population persistence. The mapping process was established to create a nationally consistent, reliable and repeatable geospatial dataset that followed a common methodology. The methods developed were focused on mapping disturbances at a specific point of time, and were not designed to identify the age of disturbances, which can be of particular interest for disturbances that can be considered non-permanent, for example cutblocks. The resultant datasets were used for caribou resource selection function,habitat modeling, and assess overall disturbance levels on each caribou ranges. Anthropogenic disturbances within 57 caribou ranges across Canada were mapped. The ranges were defined by individual Provinces and Territories across Canada. Disturbances were mapped across these ranges using 2008-2010 Landsat-5 satellite imagery to provide the most up to date data possible. Originally some areas were mapped to match the date of collected caribou demographic data, however more recent imagery was used and additional disturbance features that were seen since the original mapping date were added. Within the context of this project, anthropogenic disturbance was defined as any human-caused disturbance to the natural landscape that could be visually identified from Landsat imagery at a viewing scale of 1:50,000. A minimum mapping unit (MMU) of 2 ha or approximately 22 contiguous Landsat pixels was selected. Each disturbance feature type was represented in the database by a line or polygon depending on their geometric description. Polygonal disturbances included: cutblocks, mines, reservoirs, built-up areas, well sites, agriculture, oil and gas facilities, as well as unknown features. Linear disturbances included: roads, railways, powerlines, seismic exploration lines, pipelines, dams, air strips, as well as unknown features. For each anthropogenic feature type, a clear description was established (see Appendix 7.2 of the science assessment) to maintain consistency in identifying the various disturbances in the imagery by the different interpreters. Various ancillary vector datasets were used as aids in detecting, classifying and digitizing disturbances on the Landsat imagery (a table listing these datasets and their sources has been included in a separate file). Ancillary data was used to guide interpretation and feature labelling since the ancillary data was often variable across the country in terms of completeness as well as scale. As a result, features were only digitized if they were visible in the Landsat imagery at a viewing scale of 1:50,000. A 2nd interpreter quality control phase was carried out to ensure high quality, completete and consistent data collection. A quality assessment analysis, since an actual accuracy assessment was not possible, using high resolution SPOT imagery was carried out on a sample basis. Results are included in accompanying documentation. The vector data was buffered by 500m (radius) representing the zone of influence impacting boreal caribou herds in order to calculate range disturbance levels as well as for use in the integrated risk assessment analysis. Fire polygons were merged into the anthropogenic footprint in order to create an overall disturbance footprint.
-
The North American Breeding Bird Survey (BBS) is a road-based, long-term, continental survey that focuses on measuring breeding bird abundance at 50 stops along roughly 40-km long transects. This collection houses PDFs of active BBS route maps, which are grouped by province or territory. These maps allow BBS volunteers in Canada to easily locate the start of their route, and to navigate the official route. Once available, the collection will also house the GIS shapefiles for all active and discontinued route paths in Canada, and the current locations for all 50 stops along each transect. This collection also houses archived trend results and annual indices derived from analyses prepared by the Canadian Wildlife Service using BBS data for 2009, 2011 and 2012. A link for the most current BBS trend results is provided below under Supplemental Information. Raw BBS data are publicly available through through the USGS Patuxent Wildlife Research Center's website, at the link provided below under Supplemental Information. The BBS is jointly coordinated by Environment Canada's Canadian Wildlife Service and the U.S. Geological Survey (USGS), Patuxent Wildlife Research Center. Any use of BBS data for Canada should acknowledge the hundreds of skilled volunteers in Canada who have participated in the BBS over the years, those who have served as provincial or territorial coordinators for the BBS, and the Boreal Avian Modelling Project (BAM; www.borealbirds.ca), whose collaboration was invaluable to the creation of the BBS route and stop location dataset.
-
This collection of data summarizes the companies and facilities reporting under the Fuels Information Regulations, No. 1. This dataset includes total fuel volumes, sulphur contents and masses, and companies reporting production and/or importation of liquid fuels originating from crude oils, coal or bituminous sand. The information was provided to Environment and Climate Change Canada under the Canadian Environmental Protection Act, 1999.
-
This collection of data summarizes the companies reporting under the Renewable Fuels Regulations. This data set includes total liquid petroleum fuel volumes, renewable fuel volumes, and compliance unit creation. This data set also includes information on compliance by company. The information was provided to Environment and Climate Change Canada under the Canadian Environmental Protection Act, 1999.
-
The Government of Canada’s Fuel Life Cycle Assessment (LCA) Model is a tool to calculate the life cycle carbon intensity (CI) of fuels and energy sources used and produced in Canada.