
2022
Type of resources
Topics
Keywords
Contact for the resource
Provided by
Years
Formats
Representation types
Update frequencies
status
-
The rationale for developing this product was the recognized need for a standard and adaptable marine grid that could be used for planning or analysis purposes across projects. This nested grid has five spatial resolutions: 8km, 4km, 2km, 1km, and 500m. It covers the extent of the EEZ on the Canadian Pacific coast, and further east in order to encompass the Fraser River Delta and Puget Sound to account for ecological importance. There is a step-by-step methods document that gives users information on how to recreate the grid with ArcMap.
-
Long-term freshwater quality monitoring data for Rainy River / Lake of the Woods Watershed for the past 15 years or longer for nutrients, metals, major ions, and other physical-chemical variables are included in this dataset. Monitoring is conducted by Environment and Climate Change Canada (ECCC) to assess water quality status and long-term trends, detect emerging issues, establish water quality guidelines and track the effectiveness of remedial measures and regulatory decisions. The information informs and supports the Fresh Water Action Plan.
-
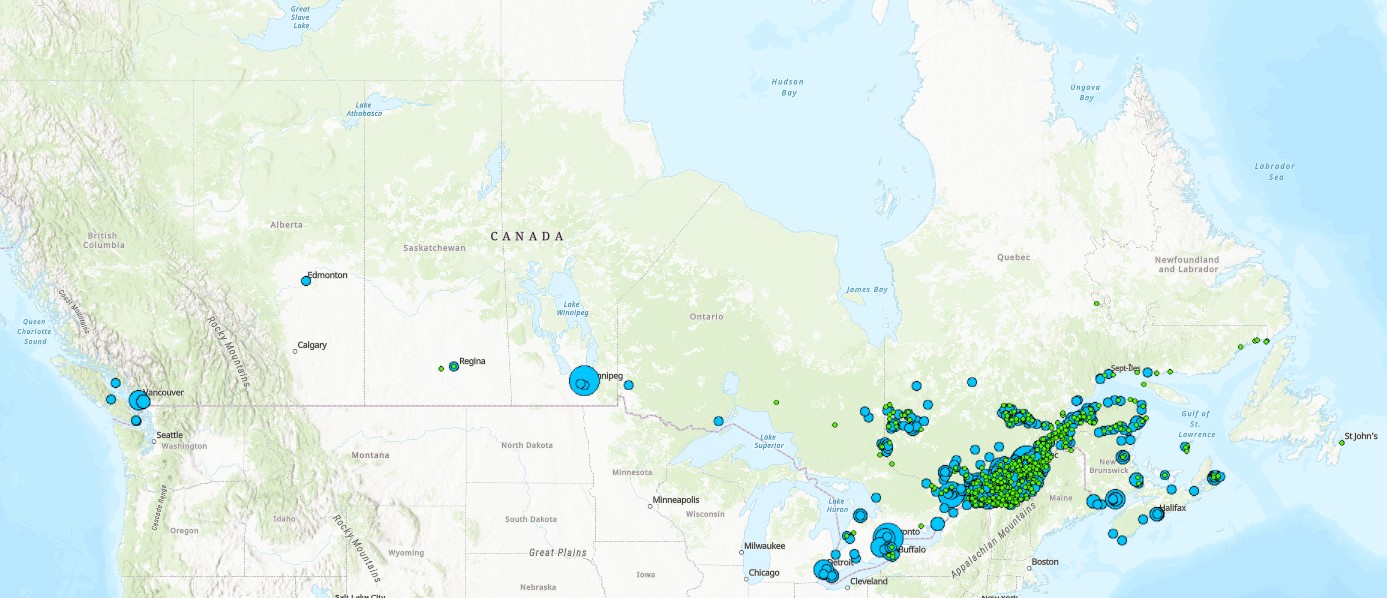
The Wastewater Systems Effluent Regulations (WSER), developed under the Fisheries Act, came into force in 2012 to manage wastewater releases by systems that collect an average daily influent volume of 100 cubic metres or more. The WSER also does not apply to any wastewater system located in the Northwest Territories, Nunavut and north of the 54th parallel in the provinces of Quebec and Newfoundland and Labrador. The WSER set national baseline effluent quality standards that are achievable through secondary wastewater treatment. The province of Quebec provided some combined sewer overflow data for 2020, which includes information on whether a discharge occurred at a combined sewer overflow point during the year. The map below shows the number of CSO points with at least one overflow event within each wastewater system. The map is available in both ESRI REST (to use with ARC GIS) and WMS (open source) formats. For more information about the individual reporting wastewater systems, datasets are available in either CSV or XLS formats. More information on the wastewater sector including the regulations, agreements, contacts and resource documents is available at: https://www.canada.ca/wastewater
-
The Government of Canada’s Fuel Life Cycle Assessment (LCA) Model is a tool to calculate the life cycle carbon intensity (CI) of fuels and energy sources used and produced in Canada.
-
The Emergencies Science Division of ESTC provides Spills Technology Databases including Brochures, Oil Properties, Chemical Synonyms, PPA Instruments and Tanker Spills. This database contains information on the properties of various types of oils, a chemical thesaurus where one can look up synonymous chemical names, and information on over 700 tanker spills
-
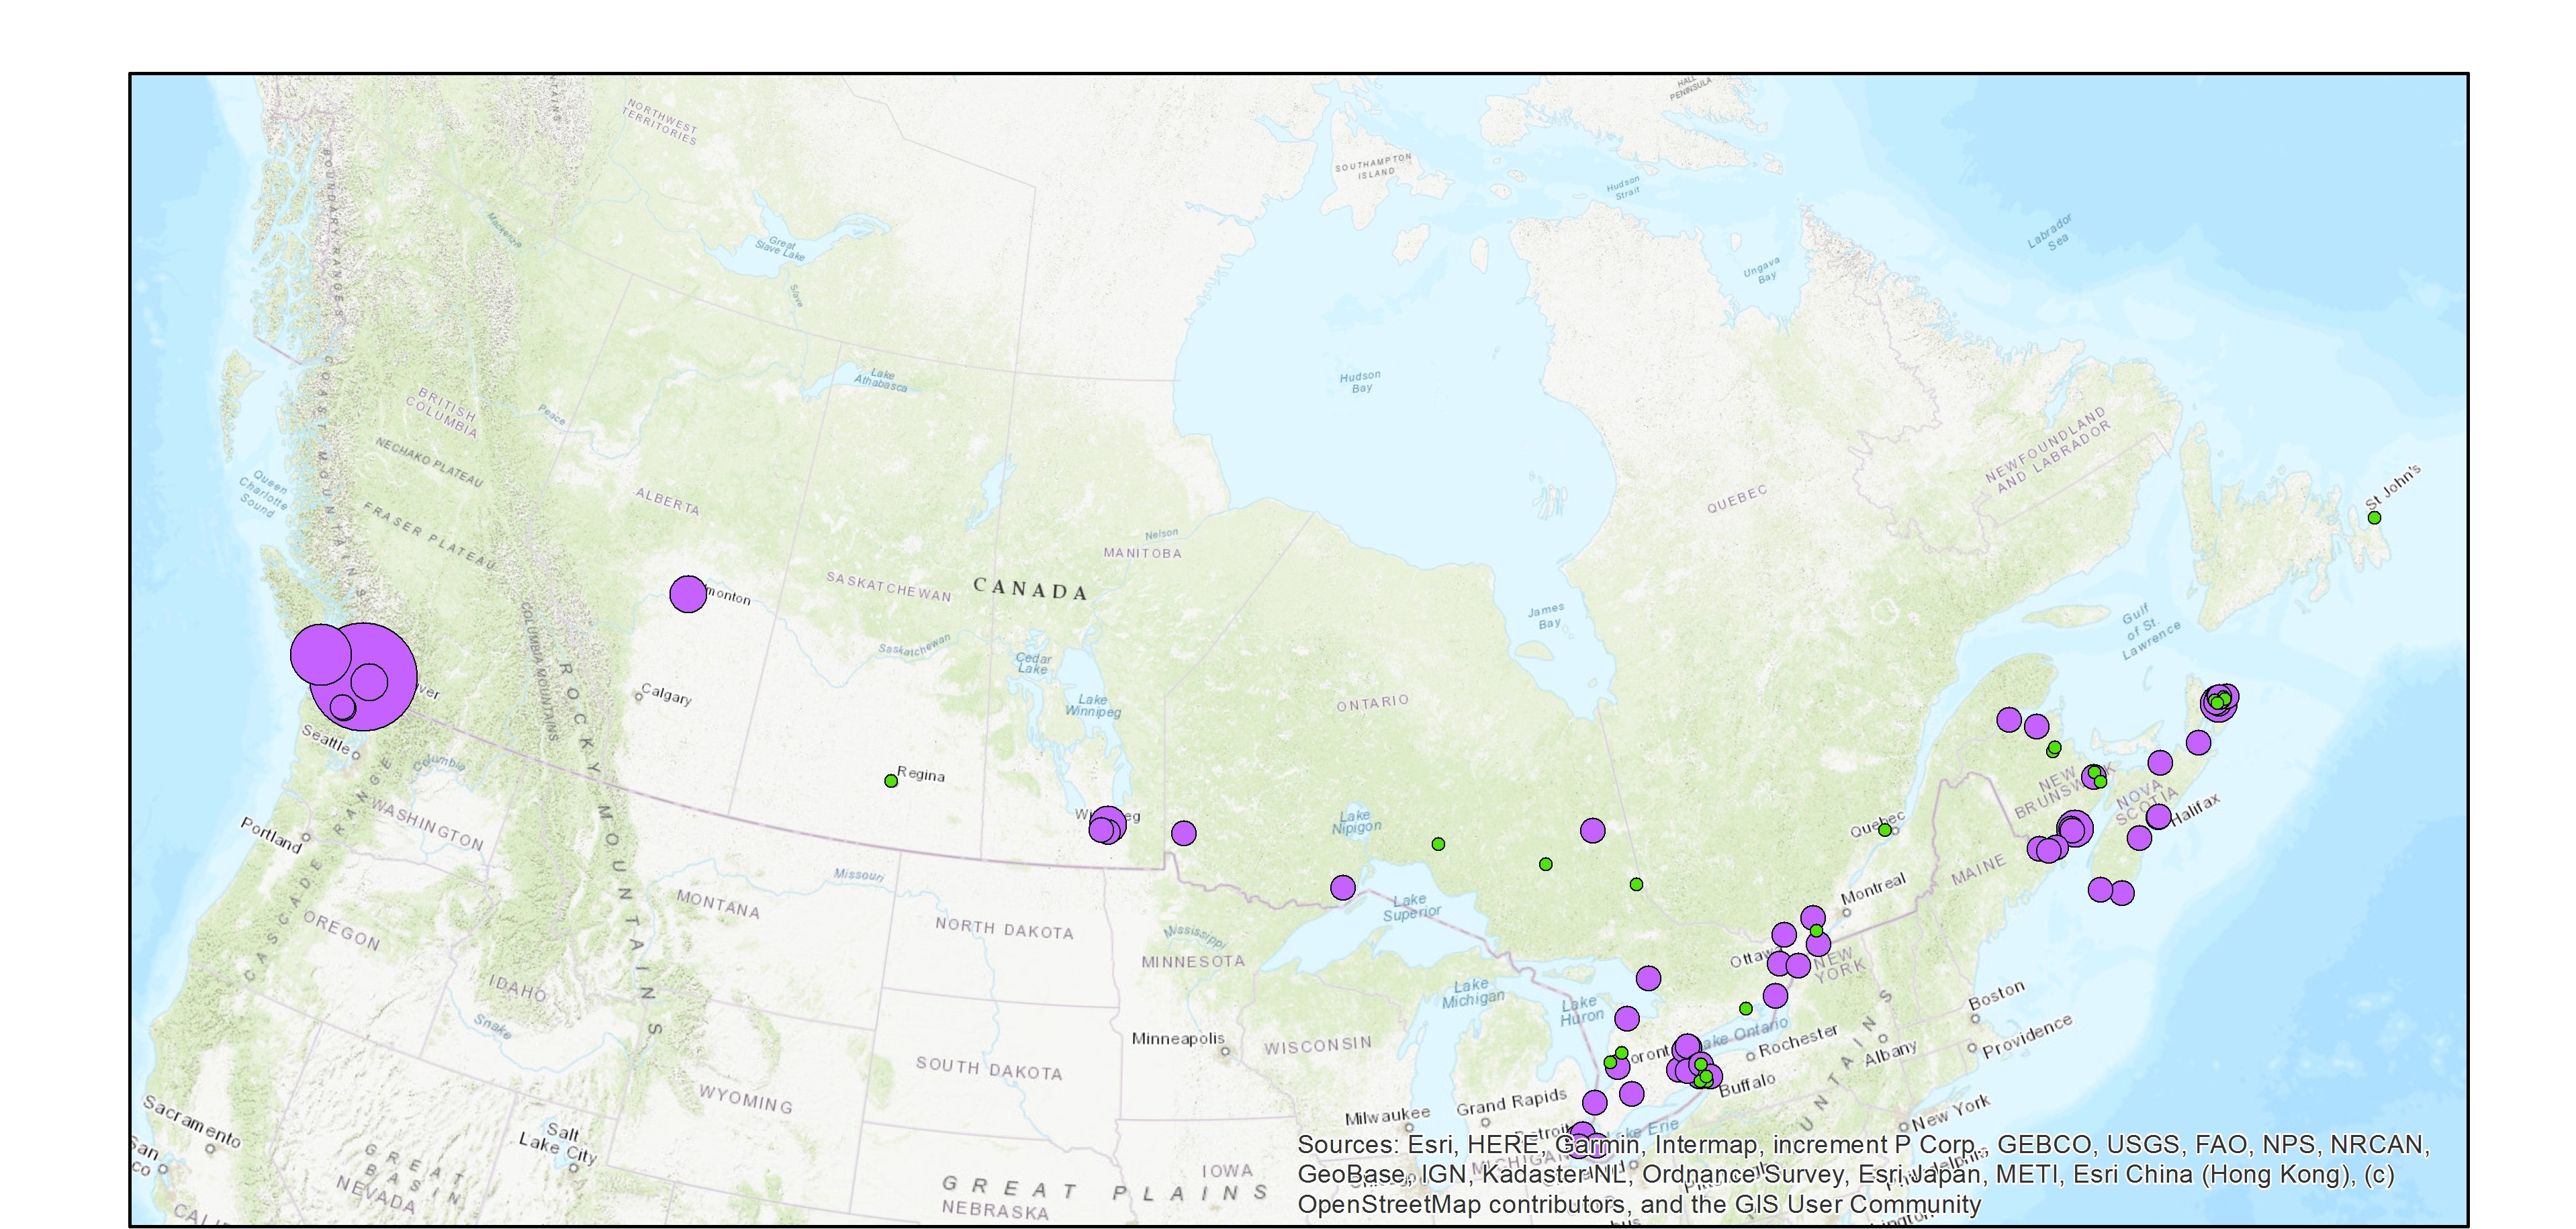
The Wastewater Systems Effluent Regulations (WSER), developed under the Fisheries Act, came into force in 2012 to manage wastewater releases by systems that collect an average daily influent volume of 100 cubic metres or more. The WSER also does not apply to any wastewater system located in the Northwest Territories, Nunavut and north of the 54th parallel in the provinces of Quebec and Newfoundland and Labrador. The WSER set national baseline effluent quality standards that are achievable through secondary wastewater treatment. The WSER require owners or operators of wastewater systems with combined sewers to submit an annual report on the total volume and the number of days wastewater is discharged per month via combined sewer overflow (CSO) points as a result of precipitation. The map below shows the volume of effluent (in cubic metres) discharged in a year from all CSO points situated within the collection area of a wastewater system. For the most part, the volumes provided to ECCC are estimates. Please note, a value of “999999999” in the dataset indicates that the volume data is unavailable and it does not mean that a volume of 999,999,999 m3 was released within the collection area of a wastewater system. The map is available in both ESRI REST (to use with ARC GIS) and WMS (open source) formats. For more information about the individual reporting wastewater systems, datasets are available in either CSV or XLS formats. Data from Quebec As of 2018, no combined sewer overflow volumes from Quebec municipalities are available since an equivalency agreement is now in effect. More information on the wastewater sector including the regulations, agreements, contacts and resource documents is available at: https://www.canada.ca/wastewater
-
The Canadian Environmental Sustainability Indicators (CESI) program provides data and information to track Canada's performance on key environmental sustainability issues. The Pulp and paper effluent quality indicator reports the percentage of acute lethality, biochemical oxygen demand and total suspended solid tests that are within the regulatory limits for selected years between 1985 and 2020. The purpose of the Pulp and Paper Effluent Regulations is to manage threats to fish, fish habitat, and human health from fish consumption by limiting the deposit of deleterious substances from pulp and paper mills into water frequented by fish. Ensuring that pulp and paper mill operators meet environmental protection standards helps to protect our aquatic environment for future generations. Information is provided to Canadians in a number of formats including: static and interactive maps, charts and graphs, HTML and CSV data tables and downloadable reports. See the supplementary documentation for the data sources and details on how the data were collected and how the indicator was calculated. Canadian Environmental Sustainability Indicators: https://www.canada.ca/environmental-indicators
-
"The Canadian Environmental Sustainability Indicators (CESI) program provides data and information to track Canada's performance on key environmental sustainability issues. The Air pollutant emissions indicators track emissions from human activities of 6 key air pollutants: sulphur oxides, nitrogen oxides, volatile organic compounds, ammonia, carbon monoxide and fine particulate matter. Black carbon, which is a component of fine particulate matter, is also reported. Sectoral indicators on air pollutant emissions from transportation, off-road vehicles and mobile equipment, electric utilities and the oil and gas industry provide additional analysis on the largest sources of Canada's air pollutant emissions. For each air pollutant, the indicators are provided at the national and provincial/territorial levels. They also identify the major sources of emissions and provide links to detailed information on air pollutant emissions from facilities. The Air pollutant emissions indicators are intended to inform Canadians and decision makers about progress made towards reducing emissions from human-related sources of air pollutants and about the effectiveness of emission reduction measures implemented to improve ambient air quality in Canada. Information is provided to Canadians in a number of formats including: static and interactive maps, charts and graphs, HTML and CSV data tables and downloadable reports. See the supplementary documentation for the data sources and details on how the data were collected and how the indicator was calculated. Canadian Environmental Sustainability Indicators: https://www.canada.ca/environmental-indicators