
RI_532
Type of resources
Topics
Keywords
Contact for the resource
Provided by
Years
Formats
Representation types
Update frequencies
status
-
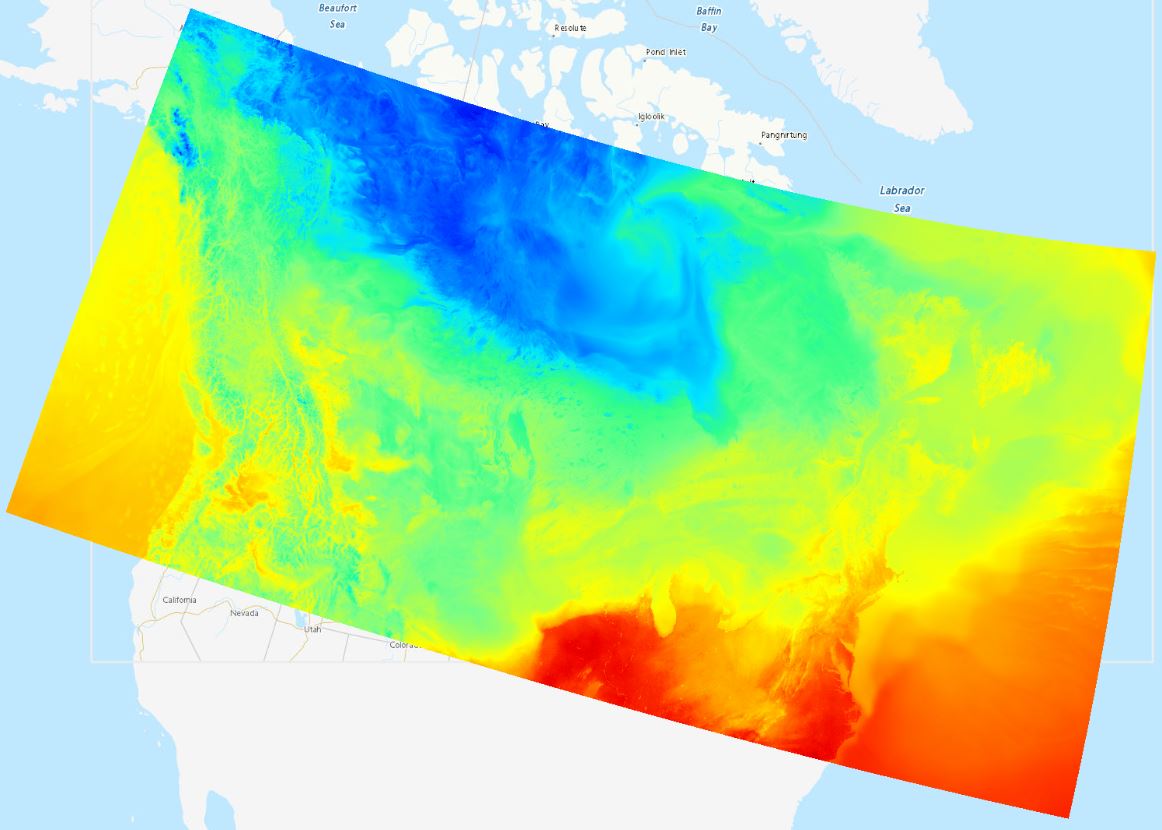
The Regional Air Quality Deterministic Prediction System FireWork (RAQDPS-FW) carries out physics and chemistry calculations, including emissions from active wildfires, to arrive at deterministic predictions of chemical species concentration of interest to air quality, such as fine particulate matter PM2.5 (2.5 micrometers in diameter or less). Geographical coverage is Canada and the United States. Data is available at a horizontal resolution of 10 km. While the system encompasses more than 80 vertical levels, data is available only for the surface level. The products are presented as historical, annual or monthly, averages which highlight long-term trends in cumulative effects on the environment.
-
Weather Elements on Grid (WEonG) based on the High Resolution Deterministic Prediction System (HRDPS) is a post-processing system designed to compute the weather elements required by different forecast programs (public, marine, aviation, air quality, etc.). This system amalgamates numerical and post-processed data using various diagnostic approaches. Hourly concepts are produced from different algorithms using outputs from the pan-Canadian High Resolution Deterministic Prediction System (HRDPS-NAT).
-
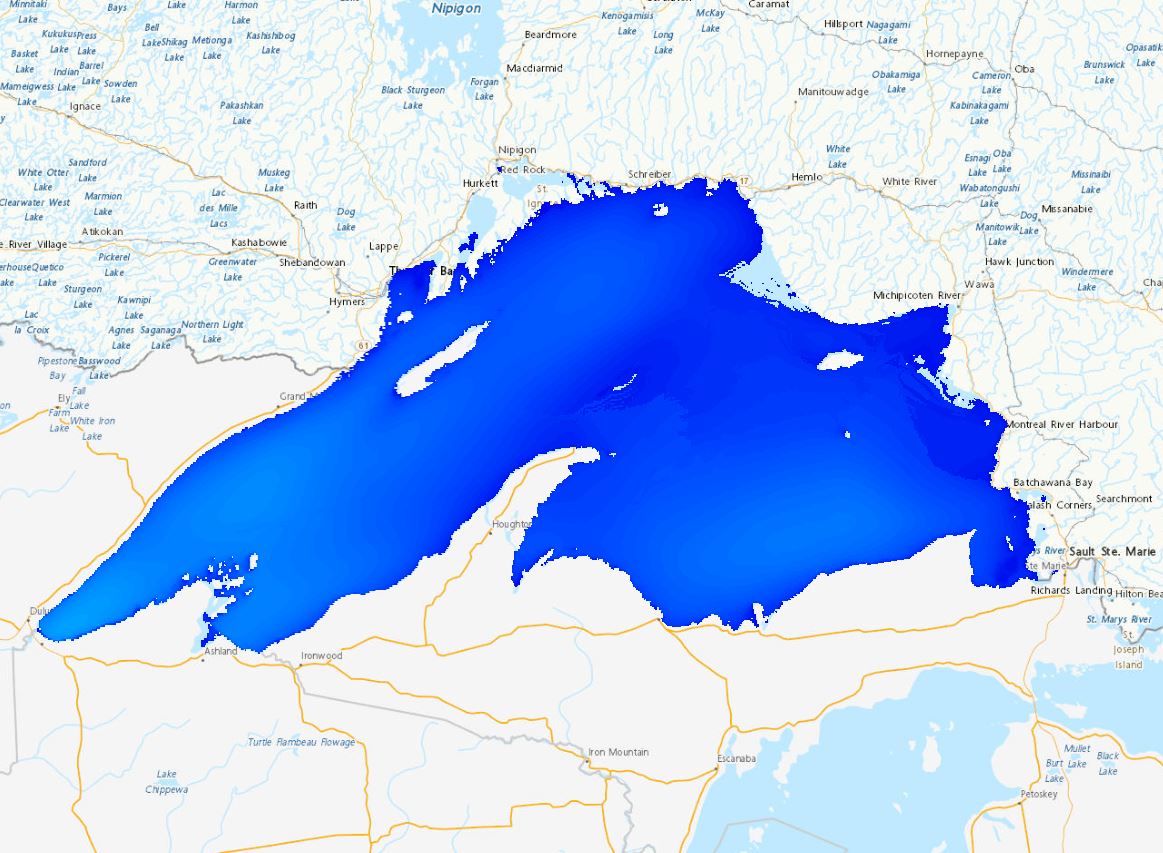
The Regional Deterministic Wave Prediction System (RDWPS) produces wave forecasts out to 48 hours in the future using the third generation spectral wave forecast model WaveWatch III® (WW3). The model is forced by the 10 meters winds from the High Resolution Deterministic Prediction System (HRDPS). Over the Great Lakes, an ice forecast from the Water Cycle Prediction System of the Great Lakes (WCPS) is used by the model to attenuate or suppress wave growth in areas covered by 25% to 75% and more than 75% ice, respectively. Over the ocean, an ice forecast from the Regional Ice Ocean Prediction System (RIOPS) is used: in the Northeast Pacific, waves propagate freely for ice concentrations below 50%, above this threshold there is no propagation; in the Northwest Atlantic the same logic is used as in the Great Lakes. Forecast elements include significant wave height, peak period, partitioned parameters and others. This system includes several domains: Lake Superior, Lake Huron-Michigan, Lake Erie, Lake Ontario, Atlantic North-West and Pacific North-East.
-
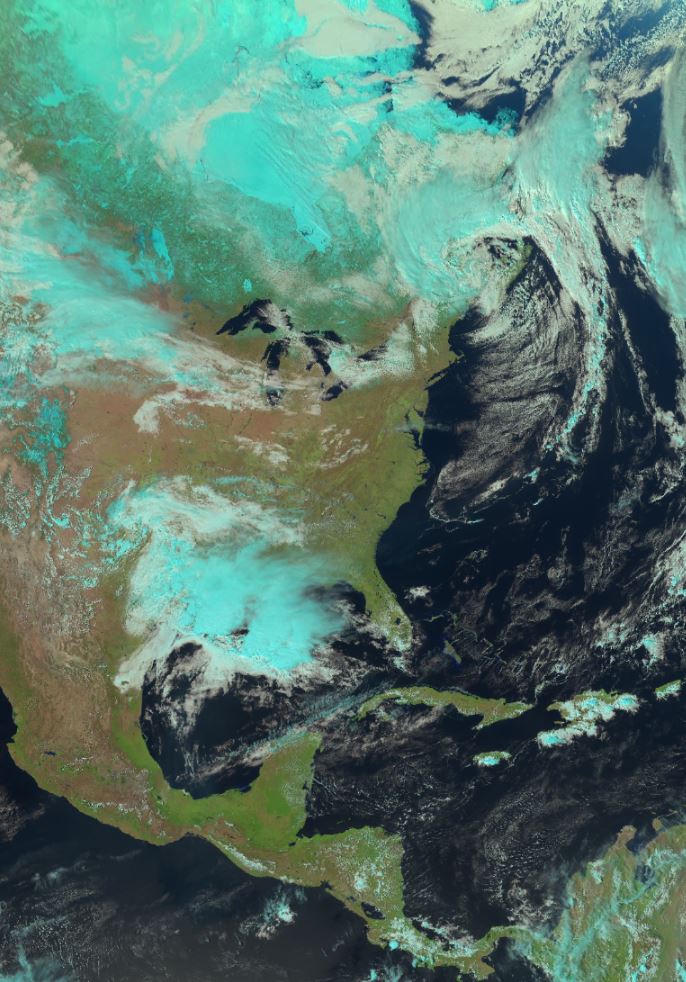
These products are derived from RGB (red/green/blue) images, a satellite processing technique that uses a combination of satellite sensor bands (also called channels) and applies a red/green/blue (RGB) filter to each of them. The result is a false-color image, i.e. an image that does not correspond to what the human eye would see, but offers high contrast between different cloud types and surface features. The on-board sensor of a weather satellite obtains two basic types of information: visible light data (reflected light) reflecting off clouds and different surface types, also known as "reflectance", and infrared data (emitted radiation) which are long-wave radiations emitted by clouds and surface features. RGBs are specially designed to combine this type of satellite data, resulting in an information-rich final product. Four types of products are currently generated from the GOES-West and GOES-East satellites: "NightIR" and "NightMicrophysics", at 2km resolution, are generated 24 hours a day with infrared channels, so are visible both night and day, and "NaturalColour" and "DayCloudConvection", at 1km resolution, which combine visible light channels with infrared channels; their higher resolution makes the latter two products more popular, but they are not available during most of the night (between 02UTC and 07UTC for GOES-Est, and between 06UTC and 11UTC for GOES-Ouest) given the absence of reflected sunlight. Other RGB products should be added gradually in the future to meet different needs.
-
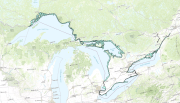
The Great Lakes Migrant Waterfowl Surveys provide periodic data on waterfowl abundance, spatial and temporal distributions, and use along the shorelines of major water bodies and river systems in Ontario during mostly during spring and fall, and to a lesser extent during summer and winter, seasons. The primary survey area covers the shoreline and nearshore (~1km) waters of the Lower Great Lakes region of Ontario, specifically including the St. Lawrence River, Lake Ontario, Niagara River, Lake Erie, Detroit River and Lake St. Clair and associated major marshes and embayments. Aerial surveys, typically flown several times within spring (March –May: 1969, 1971, 1972, 1975 –1979, 1981, 1982, 1984 –1988, 1991 –1996, 1998 –2003 & 2009 –2011) and fall (September –December: 1968, 1970, 1971, 1974 –2003 & 2009 –2011) survey periods, have been conducted periodically on a relatively regular basis (approx. 5-10 years) along the Lower Great Lakes shorelines between 1968 and 2011. Smaller-scale surveys also have been conducted periodically during summer (June –August: 1968 –1970, 1972, 1974, 1975, 1977, 1982, 1984, 1986, 1989, 1999 & 2002) in this region. This survey often has been conducted in conjunction with the Midwinter Survey, so its data (up to 2004) also are included in the CWS Migrant Waterfowl Surveys database (Year ≥2004 & Month = January & February).Data from several aerial surveys conducted periodically during the non-breeding period outside the Lower Great Lakes region also are included in this database. Spring and fall surveys have been conducted along the shorelines and nearshore waters of the Upper Great Lakes region of Ontario, specifically at St. Clair River (Fall 2012 & 2013), Lake Huron (Fall 1973, 1996; Spring 1974) / Georgian Bay (Fall 1973, 1996, 2012 & 2013) & Lake Superior (Fall 2000). Aerial surveys also have been conducted inland in southeastern Ontario along the Rideau River (Fall 1998 & Spring 1999).
-
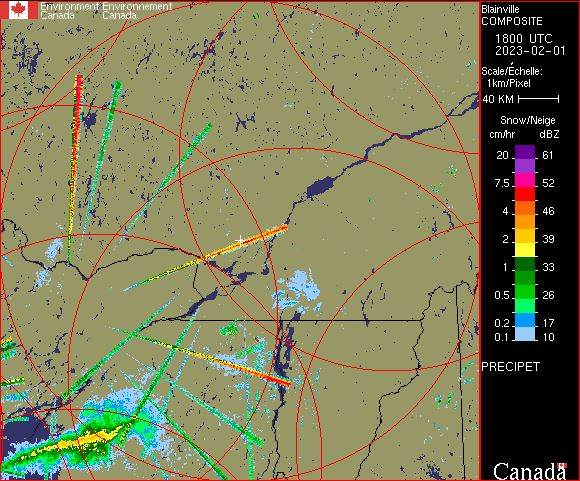
The PRECIP-ET (PRECIPET on images) is an extension of the PRECIP product (hence the use of ET in the product name). Compared to the previous PRECIP product, the PRECIP-ET performs a suite of additional quality control (QC) tests and tracks issues better. For example, Doppler filters might be rejecting moderate ground echoes in a particular area and thus weak meteorological echoes would not be detectible. In this case, PRECIP-ET would flag the missing data area, whereas PRECIP would simply treat the area as no echoes. This additional quality treatment is why we have migrated to PRECIP-ET in 2013, to get an improved service. The PRECIP-ET image is designed to show the precipitation close to the ground, by using Doppler technology processing for echoes within 128 km from the radar site for the C-Band radars and 240 km for the new S-Band radars. Doppler technology allows for better resolution of the precipitation echoes and also provides the ability to detect the movement of precipitation in relation to the radar (i.e. are the raindrops or snowflakes moving towards or away from the radar and at what speed). Beyond this 128 km limit, the echoes are displayed using the more conventional CAPPI processing.
-
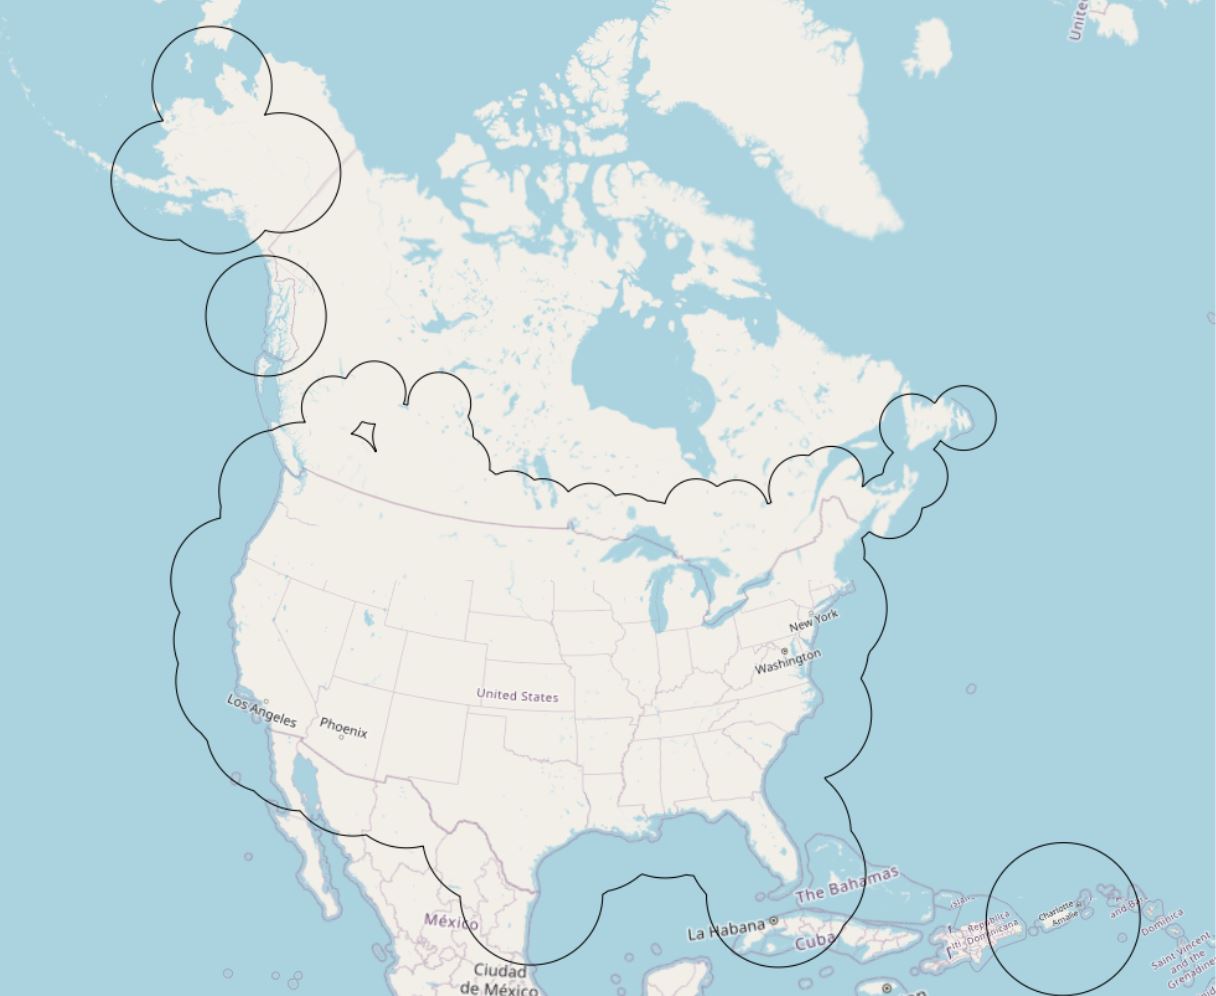
Radar coverage is provided to dynamically display the zones covered by the radars every 6 minutes, and to provide information on the availability (or not) of the contributing radars as well as on the areas of overlap.
-
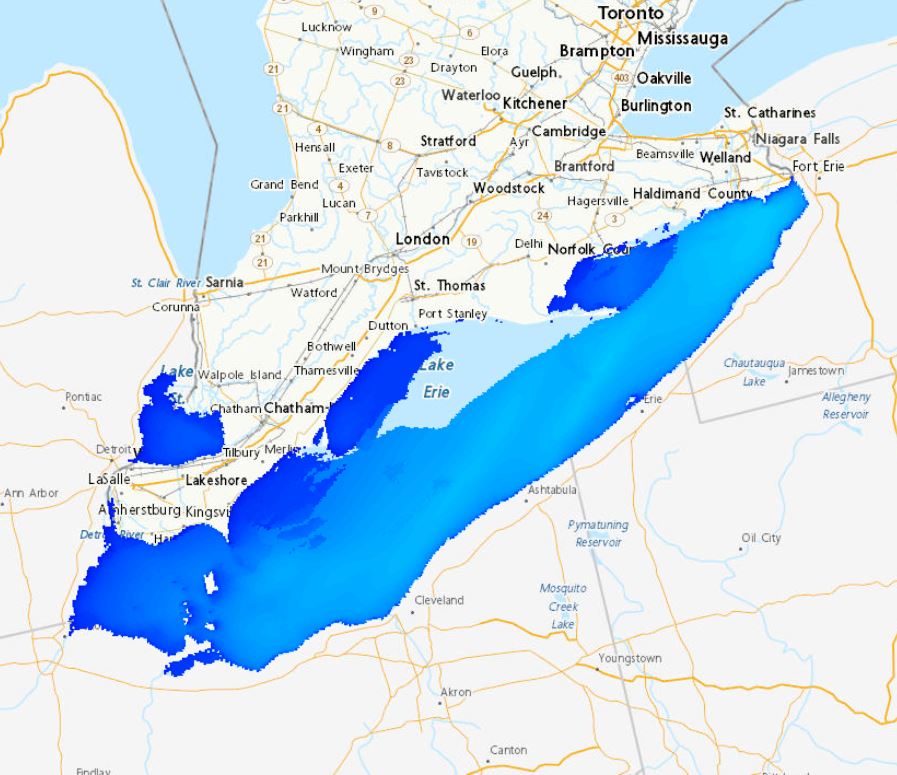
The Regional Deterministic Wave Prediction System (RDWPS) produces wave forecasts out to 48 hours in the future using the third generation spectral wave forecast model WaveWatch III® (WW3). The model is forced by the 10 meters winds from the High Resolution Deterministic Prediction System (HRDPS). Over the Great Lakes, an ice forecast from the Water Cycle Prediction System of the Great Lakes (WCPS) is used by the model to attenuate or suppress wave growth in areas covered by 25% to 75% and more than 75% ice, respectively. Over the ocean, an ice forecast from the Regional Ice Ocean Prediction System (RIOPS) is used: in the Northeast Pacific, waves propagate freely for ice concentrations below 50%, above this threshold there is no propagation; in the Northwest Atlantic the same logic is used as in the Great Lakes. Forecast elements include significant wave height, peak period, partitioned parameters and others. This system includes several domains: Lake Superior, Lake Huron-Michigan, Lake Erie, Lake Ontario, Atlantic North-West and Pacific North-East.
-
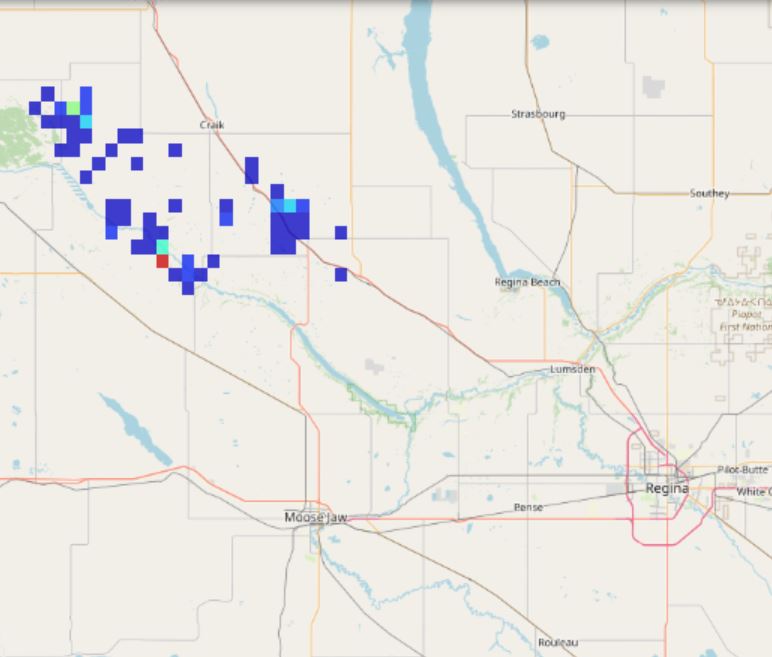
The Canadian Lightning Detection Network (CLDN) provides lightning monitoring across most of Canada. The data distributed here represents a spatio-temporal aggregation of the observations of this network available with an accuracy of a few hundred meters. More precisely, every 10 minutes, the reported observations are processed in the following way: The location of observed lightning (cloud-to-ground and intra-cloud) in the last 10 minutes is extracted. Using a regular horizontal grid of about 2.5km by 2.5km, the number of observed lightning flashes within each grid cell is calculated. These grid data are normalized by the exact area of each cell (in km2) and by the accumulation period (10min) to obtain an observed flash density expressed in km-2 and min-1. A mask is applied to remove data located more than 250km from Canadian land or sea borders.
-
Short-duration rainfall intensity-duration-frequency (IDF) statistics in the form of tables and graphs with accompanying documentation for 549 locations across Canada. These files can be downloaded for each province, territory or for all of Canada.