
RI_536
Type of resources
Topics
Keywords
Contact for the resource
Provided by
Years
Formats
Representation types
Update frequencies
status
-
This daily forecast describes the ice edge using latitude and longitude coordinates, the total ice concentration, the predominant ice stage of development and the concentration of the oldest ice type. Warnings are issued as appropriate. The forecasts are valid from the time of issue until the end of the following day (so for a period of 24 to 48 hours).
-
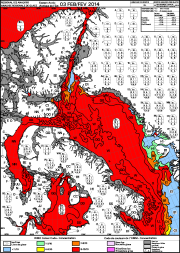
These ice charts illustrate ice conditions at a particular moment in time. The ice information is presented using a standard international code, known as the Egg Code. The following charts are available from the Canadian Ice Service: -Daily Ice Charts -Image Analysis Ice Charts -Regional Ice Charts
-
The Canadian Aquatic Biomonitoring Network (CABIN) is an aquatic biomonitoring program for assessing the health of fresh water ecosystems in Canada. Benthic macroinvertebrates are collected at a site location and their counts are used as an indicator of the health of that water body. CABIN is based on the network of networks approach that promotes inter-agency collaboration and data-sharing to achieve consistent and comparable reporting on fresh water quality and aquatic ecosystem conditions in Canada. The program is maintained by Environment and Climate Change Canada (ECCC) to support the collection, assessment, reporting and distribution of biological monitoring information. A set of nationally standardized CABIN protocols are used for field collection, laboratory work, and analysis of biological monitoring data. A training program is available to certify participants in the standard protocols. There are two types of sites in the CABIN database (reference and test). Reference sites represent habitats that are closest to “natural” before any human impact. The data from reference sites are used to create reference models that CABIN partners use to evaluate their test sites in an approach known as the Reference Condition Approach (RCA). Using the RCA models, CABIN partners match their test sites to groups of reference sites on similar habitats and compare the observed macroinvertebrate communities. The extent of the differences between the test site communities and the reference site communities allows CABIN partners to estimate the severity of the impacts at those locations. CABIN samples have been collected since 1987 and are organized in the database by study (partner project). The data is delineated by the 11 major drainage areas (MDA) found in Canada and each one has a corresponding study, habitat and benthic invertebrate data file. Links to auxiliary water quality data are provided when available. Visits may be conducted at the same location over time with repeat site visits being identified by identical study name / site code with different dates. All data collected by the federal government is available on Open Data and more partners are adding their data continually. The csv files are updated monthly. Contact the CABIN study authority to request permission to access non open data.
-
This daily forecast describes the ice edge using latitude and longitude coordinates, the total ice concentration, the predominant ice stage of development and the concentration of the oldest ice type. Warnings are issued as appropriate. The forecasts are valid from the time of issue until the end of the following day (so for a period of 24 to 48 hours).
-
Long-term freshwater quality monitoring data for over 14 sites in the Fraser River Basin for the past 15 years or longer for nutrients, metals, major ions, and other physical-chemical variables are included in this dataset. Monitoring is conducted by Environment and Climate Change Canada (ECCC) and under the Canada-British Columbia Water Quality Monitoring Agreement to assess water quality status and long-term trends, detect emerging issues, establish water quality guidelines and track the effectiveness of remedial measures and regulatory decisions.
-
Long-term freshwater quality monitoring data for over two sites in the Okanagan - Similkameen Basin for the past 15 years or longer for nutrients, metals, major ions, and other physical-chemical variables are included in this dataset. Monitoring is conducted by Environment and Climate Change Canada (ECCC) and under the Canada-British Columbia Water Quality Monitoring Agreement to assess water quality status and long-term trends, detect emerging issues, establish water quality guidelines and track the effectiveness of remedial measures and regulatory decisions.
-
Long-term freshwater quality monitoring data for two sites in the Missouri River Basin for the past 15 years or longer for nutrients, metals, major ions, and other physical-chemical variables are included in this dataset. Monitoring is conducted by Environment and Climate Change Canada (ECCC) to assess water quality status and long-term trends, detect emerging issues, establish water quality guidelines and track the effectiveness of remedial measures and regulatory decisions.
-
Long-term freshwater quality monitoring data for over 12 sites in the Saint John and St. Croix River basins for the past 15 years or longer for nutrients, metals, major ions, and other physical-chemical variables are included in this dataset. Monitoring is conducted by Environment and Climate Change Canada (ECCC) and New Brunswick Environment and Local Government through the Canada-New Brunswick Water Quality Monitoring Agreement to assess water quality status and long-term trends, detect emerging issues, establish water quality guidelines and track the effectiveness of remedial measures and regulatory decisions.
-
This daily forecast describes the ice edge using latitude and longitude coordinates, the total ice concentration, the predominant ice stage of development and the concentration of the oldest ice type. Warnings are issued as appropriate. The forecasts are valid from the time of issue until the end of the following day (so for a period of 24 to 48 hours).