
WMS
Type of resources
Topics
Keywords
Contact for the resource
Provided by
Years
Formats
Representation types
Update frequencies
status
-
The Canadian Aquatic Biomonitoring Network (CABIN) is an aquatic biomonitoring program for assessing the health of fresh water ecosystems in Canada. Benthic macroinvertebrates are collected at a site location and their counts are used as an indicator of the health of that water body. CABIN is based on the network of networks approach that promotes inter-agency collaboration and data-sharing to achieve consistent and comparable reporting on fresh water quality and aquatic ecosystem conditions in Canada. The program is maintained by Environment and Climate Change Canada (ECCC) to support the collection, assessment, reporting and distribution of biological monitoring information. A set of nationally standardized CABIN protocols are used for field collection, laboratory work, and analysis of biological monitoring data. A training program is available to certify participants in the standard protocols. There are two types of sites in the CABIN database (reference and test). Reference sites represent habitats that are closest to “natural” before any human impact. The data from reference sites are used to create reference models that CABIN partners use to evaluate their test sites in an approach known as the Reference Condition Approach (RCA). Using the RCA models, CABIN partners match their test sites to groups of reference sites on similar habitats and compare the observed macroinvertebrate communities. The extent of the differences between the test site communities and the reference site communities allows CABIN partners to estimate the severity of the impacts at those locations. CABIN samples have been collected since 1987 and are organized in the database by study (partner project). The data is delineated by the 11 major drainage areas (MDA) found in Canada and each one has a corresponding study, habitat and benthic invertebrate data file. Links to auxiliary water quality data are provided when available. Visits may be conducted at the same location over time with repeat site visits being identified by identical study name / site code with different dates. All data collected by the federal government is available on Open Data and more partners are adding their data continually. The csv files are updated monthly. Contact the CABIN study authority to request permission to access non open data.
-
The Regional Air Quality Deterministic Prediction System FireWork (RAQDPS-FW) carries out physics and chemistry calculations, including emissions from active wildfires, to arrive at deterministic predictions of chemical species concentration of interest to air quality, such as fine particulate matter PM2.5 (2.5 micrometers in diameter or less). Geographical coverage is Canada and the United States. Data is available at a horizontal resolution of 10 km. While the system encompasses more than 80 vertical levels, data is available only for the surface level. The products are presented as historical, annual or monthly, averages which highlight long-term trends in cumulative effects on the environment.
-
The Regional Deterministic Air Quality Analysis (RDAQA) is an objective analysis of surface pollutants which combines numerical forecasts from the Regional Air Quality Deterministic Prediction System (RAQDPS) and hourly observational data from monitoring surface networks over North America in order to produce a better description of the air quality at every hour. Chemical constituents include 03, SO2, and NO2 gases, as well as fine particulate matter PM2.5 (2.5 micrometers in diameter or less) and coarse particulate matter PM10 (10 micrometers in diameter or less). Geographical coverage is Canada and the United States. Data is available only for the surface level, at a horizontal resolution of 10 km. The products are presented as historical, annual or monthly, averages which highlight long-term trends in cumulative effects on the environment.
-
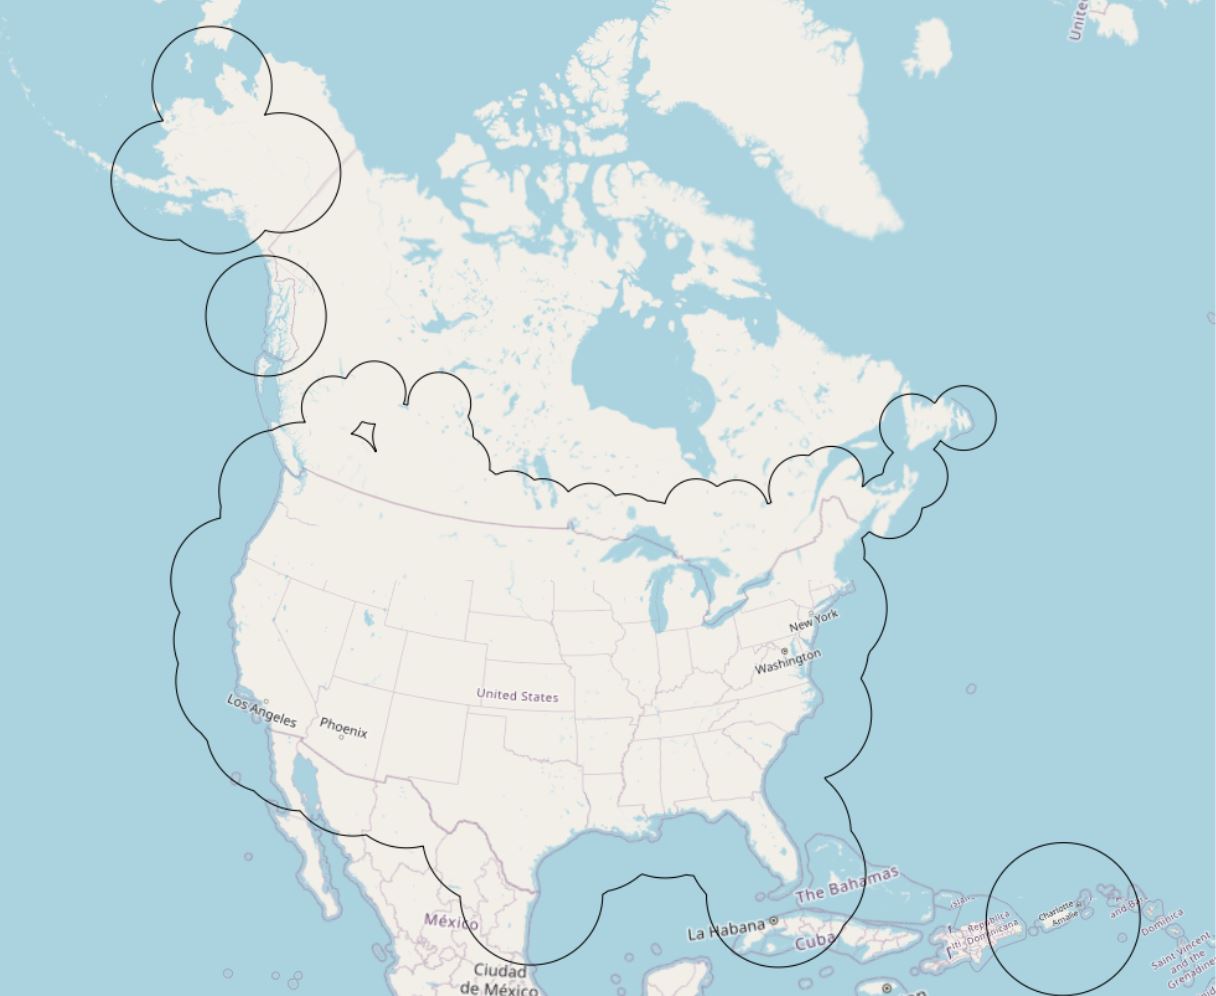
Radar coverage is provided to dynamically display the zones covered by the radars every 6 minutes, and to provide information on the availability (or not) of the contributing radars as well as on the areas of overlap.
-
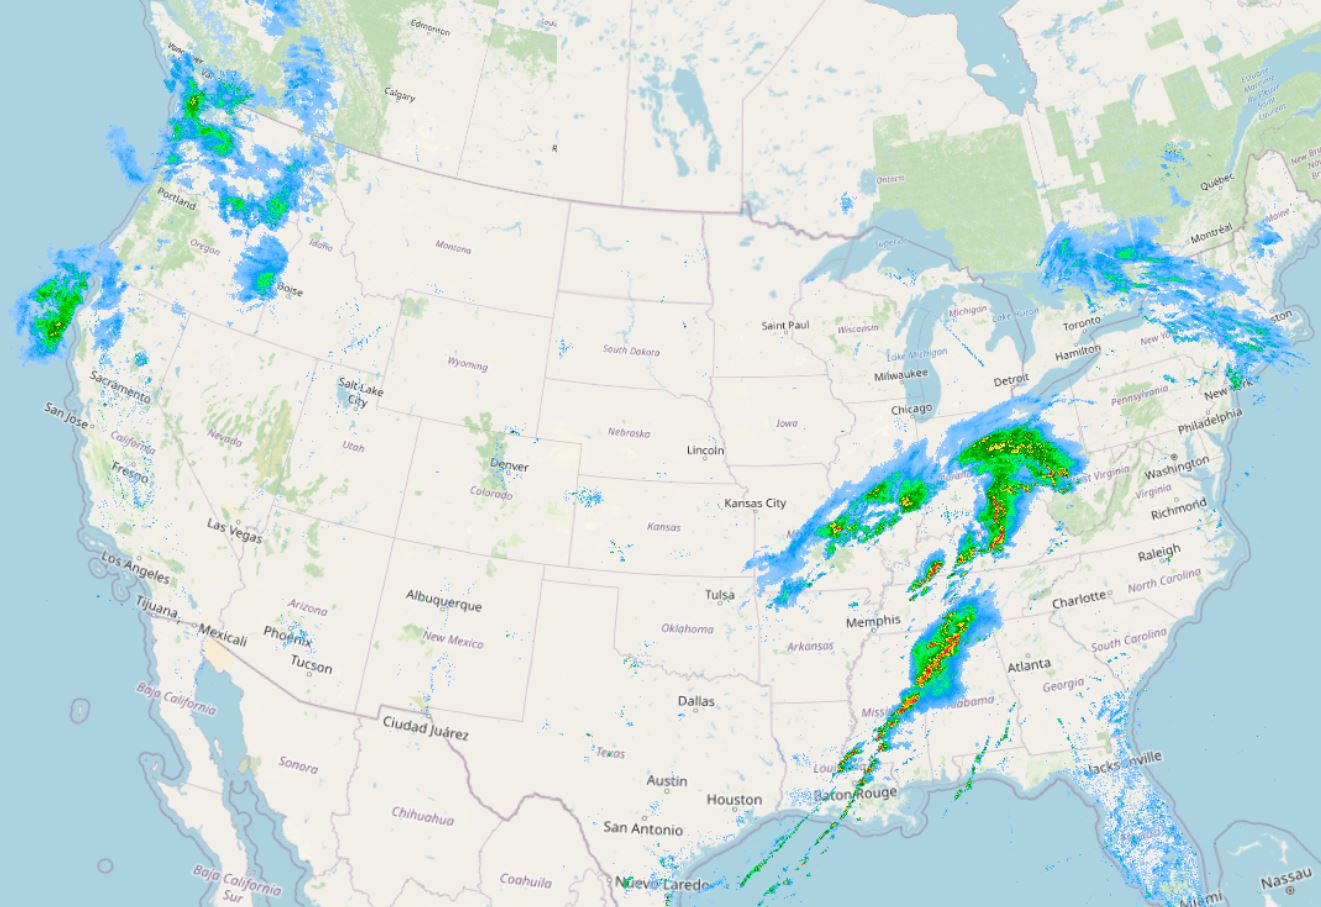
This mosaic is calculated over the North American domain with a horizontal spatial resolution of 1 km. This mosaic therefore includes all the Canadian and American radars available in the network and which can reach a maximum of 180 contributing radars. To better represent precipitation over the different seasons, this mosaic renders in mm/h to represent rain and in cm/h to represent snow. For the two precipitation types (rain and snow), we use two different mathematical relationships to convert the reflectivity by rainfall rates (mm/h rain cm/h for snow). This is a hybrid mosaic composed of different estimation precipitation products : PRECIP-ET product used only for C-Band radars (which are in the process of being replaced with S-Band radars) and DPQPE (Dual-Pol Quantitative Precipitation Estimation) for S-Band radars. For the US Nexrad radars, ECCC uses the most similar product from the US Meteorological Service (NOAA). This product displays radar reflectivity converted into precipitation rates, using the same formulas as the Canadian radars.
-
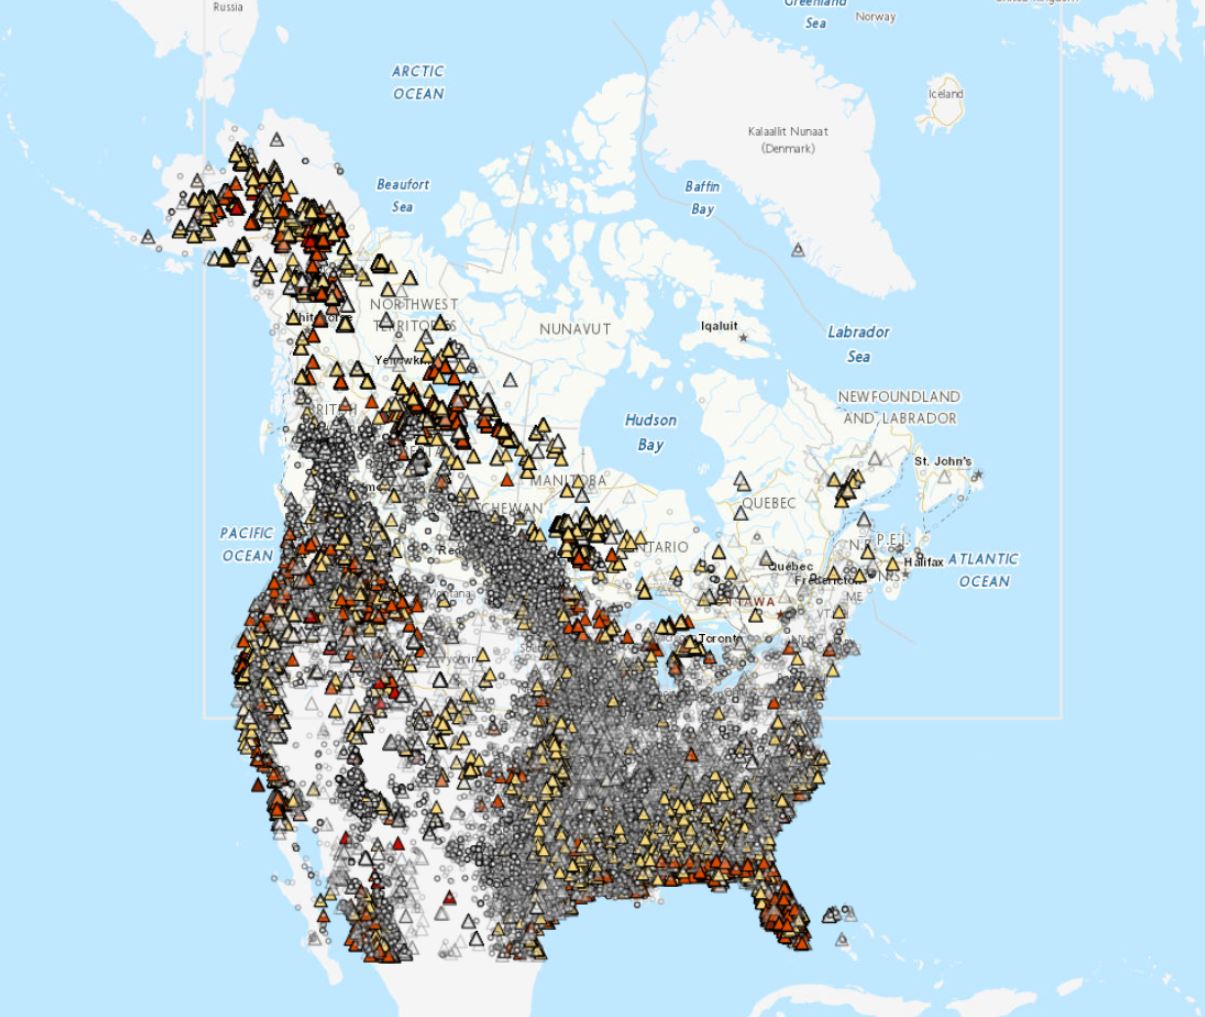
Hotspots are locations where wildfires are actively burning, identified from infrared satellite imagery. Hotspot locations are provided by NASA and NOAA, and further processed by Natural Resources Canada's Canadian Wildland Fire Information System. This layer contains the hotspots that are selected to be used as input for the Regional Air Quality Deterministic Prediction System FireWork (RAQDPS-FW) to enable forecasting air quality while taking into account wildfire emissions. Geographical coverage is Canada and the United States. The products are presented as historical annual compilations which highlight long-term trends in cumulative effects on the environment.
-
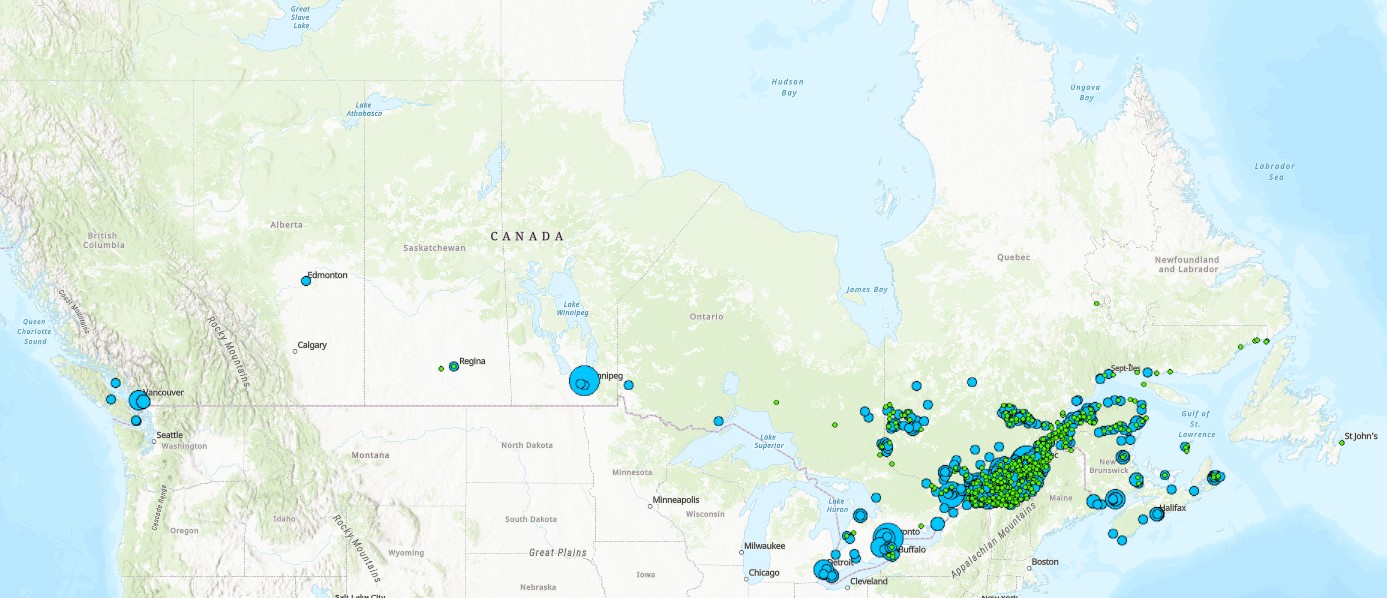
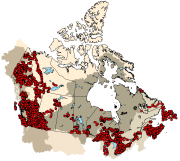
The Wastewater Systems Effluent Regulations (WSER), developed under the Fisheries Act, came into force in 2012 to manage wastewater releases by systems that collect an average daily influent volume of 100 cubic metres or more. The WSER also does not apply to any wastewater system located in the Northwest Territories, Nunavut and north of the 54th parallel in the provinces of Quebec and Newfoundland and Labrador. The WSER set national baseline effluent quality standards that are achievable through secondary wastewater treatment. The province of Quebec provided some combined sewer overflow data for 2020, which includes information on whether a discharge occurred at a combined sewer overflow point during the year. The map below shows the number of CSO points with at least one overflow event within each wastewater system. The map is available in both ESRI REST (to use with ARC GIS) and WMS (open source) formats. For more information about the individual reporting wastewater systems, datasets are available in either CSV or XLS formats. More information on the wastewater sector including the regulations, agreements, contacts and resource documents is available at: https://www.canada.ca/wastewater
-
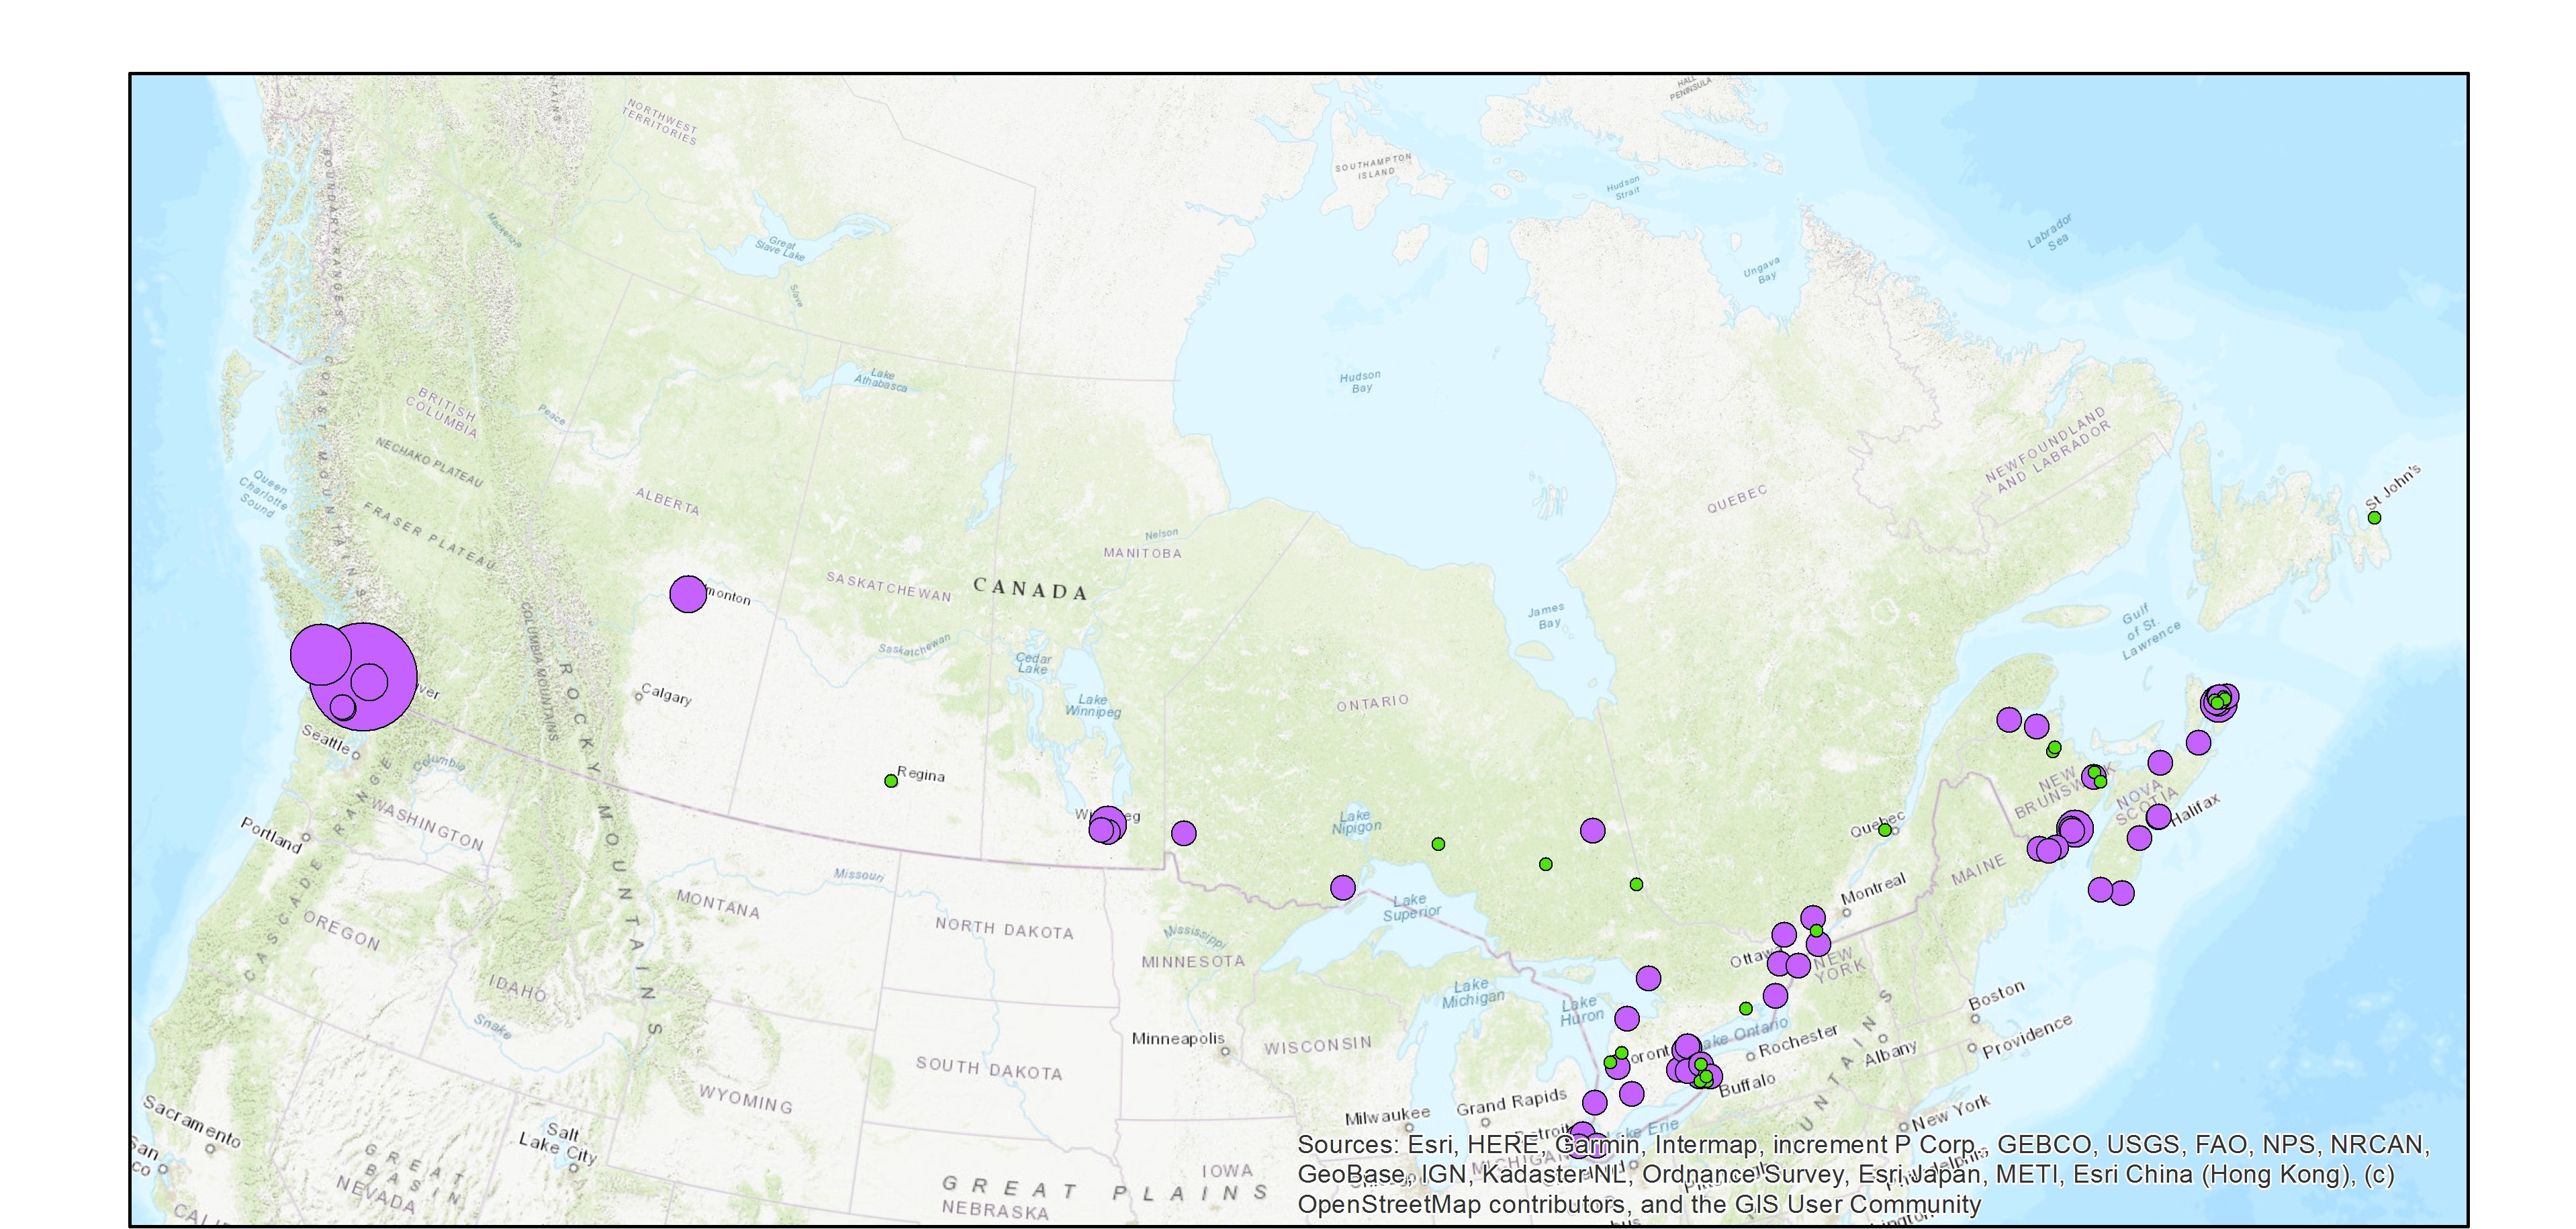
The Wastewater Systems Effluent Regulations (WSER), developed under the Fisheries Act, came into force in 2012 to manage wastewater releases by systems that collect an average daily influent volume of 100 cubic metres or more. The WSER also does not apply to any wastewater system located in the Northwest Territories, Nunavut and north of the 54th parallel in the provinces of Quebec and Newfoundland and Labrador. The WSER set national baseline effluent quality standards that are achievable through secondary wastewater treatment. The WSER require owners or operators of wastewater systems with combined sewers to submit an annual report on the total volume and the number of days wastewater is discharged per month via combined sewer overflow (CSO) points as a result of precipitation. The map below shows the volume of effluent (in cubic metres) discharged in a year from all CSO points situated within the collection area of a wastewater system. For the most part, the volumes provided to ECCC are estimates. Please note, a value of “999999999” in the dataset indicates that the volume data is unavailable and it does not mean that a volume of 999,999,999 m3 was released within the collection area of a wastewater system. The map is available in both ESRI REST (to use with ARC GIS) and WMS (open source) formats. For more information about the individual reporting wastewater systems, datasets are available in either CSV or XLS formats. Data from Quebec As of 2018, no combined sewer overflow volumes from Quebec municipalities are available since an equivalency agreement is now in effect. More information on the wastewater sector including the regulations, agreements, contacts and resource documents is available at: https://www.canada.ca/wastewater
-
The National Pollutant Release Inventory (NPRI) is Canada's public inventory of pollutant releases (to air, water and land), disposals and transfers for recycling. This file is a geodatabase (GDB) that shows the locations of all facilities that reported to the NPRI in the current reporting year. The data are also available in a virtual globe format : https://open.canada.ca/data/en/dataset/d9be6bec-47e5-4835-8d01-d2875a8d67ff Please consult the following resources to enhance your analysis: - Guide on using and Interpreting NPRI Data: https://www.canada.ca/en/environment-climate-change/services/national-pollutant-release-inventory/using-interpreting-data.html - Access additional data from the NPRI, including datasets and mapping products: https://www.canada.ca/en/environment-climate-change/services/national-pollutant-release-inventory/tools-resources-data/exploredata.html
-
The National Pollutant Release Inventory (NPRI) is Canada's public inventory of pollutant releases (to air, water and land), disposals and transfers for recycling. The file contains facility-specific data reported to the NPRI listed by media of release and by disposal and transfer. Facilities are categorized by industrial sector and total reported quantities. The data are for the most recent reporting year. Please consult the following resources to enhance your analysis: - Guide on using and Interpreting NPRI Data: https://www.canada.ca/en/environment-climate-change/services/national-pollutant-release-inventory/using-interpreting-data.html - Access additional data from the NPRI, including datasets and mapping products: https://www.canada.ca/en/environment-climate-change/services/national-pollutant-release-inventory/tools-resources-data/exploredata.html