
GEOJSON
Type of resources
Topics
Keywords
Contact for the resource
Provided by
Years
Formats
Representation types
Update frequencies
status
-
Statistical post-processing of weather and environmental forecasts issued by numerical models, including the Global Deterministic Prediction System (GDPS), reduces systematic bias and error variance of raw numerical forecasts. This is achieved by establishing an optimal relationship between observations recorded at stations and co-located numerical model outputs. The Updatable Model Output Statistics (UMOS) system at Environment Canada carries out this task. The statistical relationships are built using the Model Output Statistics (MOS) method and a multiple linear regression (MLR) technic. The weather and environmental variable being statistically post-processed by UMOS consists of air temperature at approximately 1.5 meters above ground. The absence of a statistically post-processed forecast can be caused by a missing statistical model due to insufficient observation data quality or quantity. Geographical coverage includes weather stations across Canada. Statistically post-processed forecasts are available at the same frequency of emission as the numerical model producing the raw forecasts and at 3-hourly lead times up to 144 hours (6 days) for the GDPS.
-
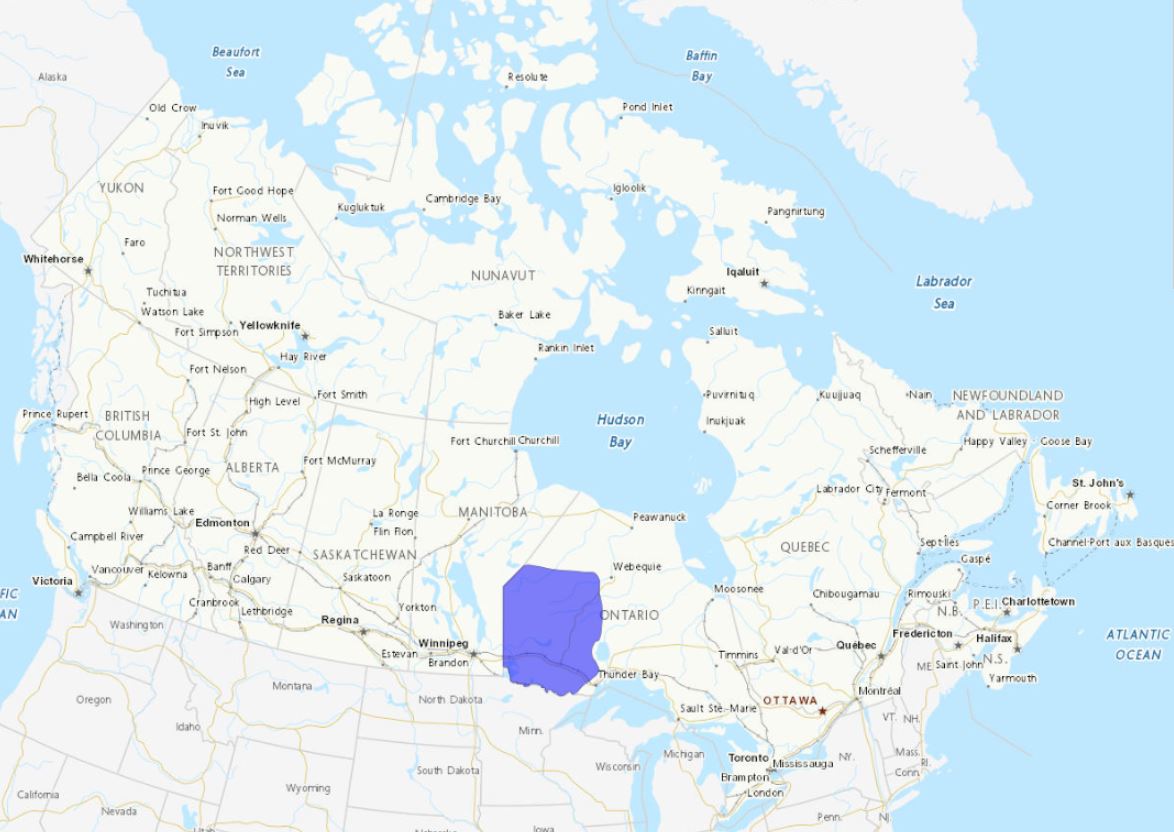
MetNotes are a geo- and time-referenced, free form polygon product issued by MSC that complement today's location-based dissemination systems. The concise text of a MetNote (similar to a Tweet) is consistent with communication today where people are seeking information at a glance. Meteorologists will issue a MetNote to add contextual and/or impact information to complement the public forecast that is valid over a specific area, for a specific time range.
-
Statistical post-processing of weather and environmental forecasts issued by numerical models, including the Regional Deterministic Prediction System (RDPS), reduces systematic bias and error variance of raw numerical forecasts. This is achieved by establishing an optimal relationship between observations recorded at stations and co-located numerical model outputs. The Updatable Model Output Statistics (UMOS) system at Environment Canada carries out this task. The statistical relationships are built using the Model Output Statistics (MOS) method and a multiple linear regression (MLR) technic. The weather and environmental variables being statistically post-processed by UMOS include air temperature and dew point temperature at approximately 1.5 meters above ground as well as wind speed and direction at 10 meters above ground or at the anemometer level in the case of a buoy. The absence of a statistically post-processed forecast can be caused by a missing statistical model due to insufficient observation data quality or quantity. In addition, the absence of a post-processed forecast for wind direction could also be due to weak forecasted wind components preventing the calculation of reliable results. The forecasts of wind speed and direction are produced from independent statistical post-processing models. Geographical coverage includes weather stations across Canada. Statistically post-processed forecasts is available at the same frequency of emission as the numerical model producing the raw forecasts and at 3-hourly lead times for the RDPS.
-

The monthly mean is the average of daily mean values for a given month.
-

The daily mean is the average of all unit values for a given day.
-
Anomalous weather resulting in Temperature and Precipitation extremes occurs almost every day somewhere in Canada. For the purpose of identifying and tabulating daily extremes of record for temperature, precipitation and snowfall, the Meteorological Service of Canada has threaded or put together data from closely related stations to compile a long time series of data for about 750 locations in Canada to monitor for record-breaking weather. Virtual Climate stations correspond with the city pages of weather.gc.ca. This data provides the daily extremes of record for Snowfall for each day of the year. Daily elements include: Greatest Snowfall.
-
A station is a site on a river or lake where water quantity (water level and flow) are collected and recorded.
-
A Virtual Climate station is the result of threading together climate data from proximate current and historical stations to construct a long term threaded data set. For the purpose of identifying and tabulating daily extremes of record for temperature, precipitation and snowfall, the Meteorological Service of Canada has threaded or put together data from closely related stations to compile a long time series of data for about 750 locations in Canada to monitor for record-breaking weather. The length of the time series of virtual stations is often greater than 100 years. A Virtual Climate station is always named for an “Area” rather than a point, e.g. Winnipeg Area, to indicate that the data are drawn from that area (within a 20km radius from the urban center) rather than a single precise location.
-
Anomalous weather resulting in Temperature and Precipitation extremes occurs almost every day somewhere in Canada. For the purpose of identifying and tabulating daily extremes of record for temperature, precipitation and snowfall, the Meteorological Service of Canada has threaded or put together data from closely related stations to compile a long time series of data for about 750 locations in Canada to monitor for record-breaking weather. Virtual Climate stations correspond with the city pages of weather.gc.ca. This data provides the daily extremes of record for Temperature for each day of the year. Daily elements include: High Maximum, Low Maximum, High Minimum, Low Minimum.
-
Climate Normals and Averages are used to summarize or describe the average climatic conditions of a particular location. At the completion of each decade, Environment and Climate Change Canada updates its Climate Normals for as many locations and as many climatic characteristics as possible. The Climate Normals, Averages and Extremes offered here are based on Canadian climate stations with at least 15 years of data between 1981 to 2010.