
Precipitation
Type of resources
Topics
Keywords
Contact for the resource
Provided by
Years
Formats
Representation types
Update frequencies
status
-
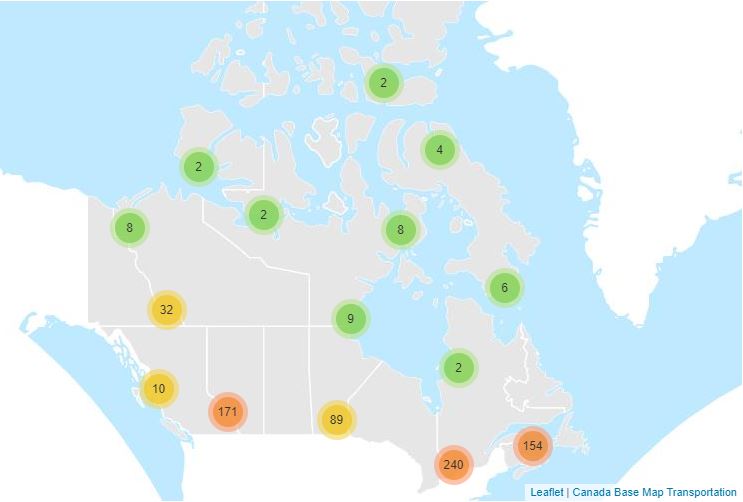
Precipitation measurements in the Environment and Climate Change Canada (ECCC) surface network are a necessary component for monitoring weather and climate and are required for flood and water resource forecasting, numerical weather prediction and many other applications that impact the health and safety of Canadians. Beginning in the late 1990s, the ECCC surface network began a transition from manual to automated precipitation measurements. Advantages to increased automation include enhanced capabilities for monitoring in remote locations and higher observation frequency at lower cost. However, transition to automated precipitation gauges has resulted in new challenges to data quality, accuracy, and homogenization. Automated weighing precipitation gauges used in the ECCC operational network, because of their physical profile, tend to measure less precipitation falling as snow because lighter particles (snow) are deflected away from the collector by the wind flow around the gauge orifice. This phenomenon of wind-induced systematic bias is well documented in the literature. The observation requires an adjustment depending on gauge and shield configuration, precipitation phase, temperature, and wind speed. Hourly precipitation, wind speed, and temperature for 397 ECCC automated surface weather stations were retrieved from the ECCC national archive. Climate Research Division (CRD) selected this sub-set of stations because they are critical to the continuity of various climate analysis. The observation period varies by station with the earliest data series beginning in 2001 (with most beginning in 2004). The precipitation data was quality controlled using established techniques to identify and flag outliers, remove spurious observations, and correct for previously identified filtering errors. The resulting hourly precipitation data was adjusted for wind bias using the WMO Solid Precipitation Inter-Comparison Experiment (SPICE) Universal Transfer Function (UTF) equation. A full description of this data set, including the station locations, data format, methodology, and references are included in the repository.
-
Two precipitation measurement super-sites were established in Saskatchewan in anticipation of the World Meteorological Organization (WMO) intercomparison initiatives for automated in-situ measurement of solid precipitation and snow (2013-2015) and to provide infrastructure support for exploring national solid precipitation measurement issues. The Bratt’s Lake site is in the central Canadian prairies approximately 30 km south of Regina. The Caribou Creek site is located in the southern Boreal forest approximately 100 km Northeast of Prince Albert. Both sites contributed to the WMO Solid Precipitation Inter-Comparison Experiment (SPICE). The objectives of these intercomparison sites are to characterize and provide guidance on the behaviour and performance of automated systems for the in-situ measurement of solid precipitation. Each of the sites provides a different perspective for measuring precipitation. Caribou Creek is characterized by a relatively longer and colder winter season but experiences lower wind speeds during precipitation due to less exposure. The Bratt’s Lake site is drier with a shorter snow accumulation season but experiences relatively high wind speeds due to high exposure, making accurate measurement of solid precipitation more problematic. The data presented here generally spans between the beginning of October and the end of April starting in the fall of 2013 (the first season of WMO-SPICE). The focus is on hourly accumulations of precipitation measured using various configurations of automated instruments and wind shields, including a WMO Double Fence Automated Reference (DFAR) measurement. Also included are matching ancillary data (wind speed and temperature) corresponding to the same measurement periods as precipitation. A more detailed description of the site measurements is included in the documentation residing in the repository. A subset of this data (2013-2017 cold seasons) was previously published in the ECCC catalogue at a 30-min temporal resolution and can be found at https://doi.org/10.18164/63773b5b-5529-4b1e-9150-10acb84d59f0 with a further description via Smith et al. (2019; https://doi.org/10.5194/essd-11-1337-2019). Unlike the previous published dataset, this publication will consist of a larger number of instrument configurations and is intended to be updated annually.
-
The dataset contains the blended (gauge and satellite estimates) monthly mean precipitation rates (unit: mm/day) for Canada for the period from January 1979 to December 2007, at a half degree spatial resolution. Please refer to the paper below for the details of the blending algorithm and input gauge and satellite data. Reference: Lin, A. and X. L. Wang, 2011: An algorithm for Blending Multiple Satellite Precipitation Estimates with in-situ Precipitation Measurements in Canada. JGR-Atmospheres, 116, D21111, doi:10.1029/2011JD016359.
-
The suite of gridded precipitation datasets includes the ANUSPLIN-gridded datasets of daily precipitation since 1900 (ANUSPLIN-AdjPdly), pentad average precipitation rates since 1950 (ANUSPLIN-AdjP5d), and monthly total precipitation since 1872 (ANUSPLIN-AdjPmly), on a 0.083333ºx 0.083333º latitude-longitude grid over Canada. For version 1 of these datasets, the daily precipitation data were generated from the ANUSPLIN surfaces fitted to the Adjusted Daily Rainfall and Snowfall (AdjDlyRS) dataset version 2016, which includes 3346 stations of manual observations (Wang et al. 2017; available at https://open.canada.ca/data/en/dataset/d8616c52-a812-44ad-8754-7bcc0d8de305). The monthly and pentad gridded data were generated from the ANUSPLIN surfaces fitted respectively to the monthly and pentad station data that were derived from the corresponding daily station data. When deriving the monthly station data from the daily station data, the monthly total precipitation was set to missing if there was one or more missing daily value in the month (zero tolerance for missing). The same zero tolerance for missing observations was applied in the calculation of the pentad average precipitation rates. Details of the ANUSPLIN modelling of these three gridded precipitation datasets are provided in MacDonald et al. (2020), along with comparison to the unadjusted ANUSPLIN-gridded daily precipitation dataset (Hutchinson et al. 2009). Note that the unadjusted precipitation data significantly underestimate both the precipitation amount and the regional mean long-term trend therein (MacDonald et al. 2020). It is important to point out that these ANUSPLIN-AdjP datasets are not homogenized and thus should not be used to assess climate trends/changes before ensuring the temporal homogeneity of the data. Considering there were no or few stations in the North in the early period, the gridded values in the period before 1930 were set to missing (missing code -999.00) for all gridpoints north of 65ºN and west of 110ºW (including 110ºW) and for all gridpoints north of 55ºN and east of 110ºW. The gridded values in the period of 1930-1949 were also set to missing for all gridpoints north of 70ºN. For the period from 1950 onwards, the grid covers the whole land mass of Canada. References: (1) MacDonald, H., D.W. McKenney, X.L. Wang, J. Pedlar, P. Papadopol, K. Lawrence, and M.F. Hutchinson, 2021: Spatial models of adjusted precipitation for Canada at varying time scales. J. Appl. Meteor. Climatol., 60, 291-304. doi: 10.1175/JAMC-D-20-0041.1. (2) Wang, X.L., H. Xu, B. Qian, Y. Feng, and E. Mekis, 2017: Adjusted daily rainfall and snowfall data for Canada. Atmos.-Ocean, 55, 155–168, doi:10.1080/07055900.2017.1342163. (3) Hutchinson, M.F.,D.W. McKenney, K. Lawrence, J.H. Pedlar, R. F.Hopkinson, E.Milewska, and P. Papadopol, 2009: Development and testing of Canada-wide interpolated spatial models of daily minimum–maximum temperature and precipitation for 1961–2003. J. Appl. Meteorol. Climatol., 48, 725-741. doi:10.1175/2008JAMC1979.1.
-
Assess the importance of atmospheric deposition of contaminants as a contributor to ecological impacts of oil sands development and identify sources. • Use snowpack measurements sampled across a gridwork to develop maps of winter-time atmospheric contaminant loadings for the region ~100 km from the major upgrading facilities • Assess long-term trends in winter-time atmospheric deposition • Determine the potential impact of wintertime snowpack mercury loads on tributary river water mercury concentrations (Spring Freshet) using Geographic Information System and hydrological modelling approaches • Compare snowpack loadings to those obtained from precipitation monitoring and compare spatial patterns to PAC air measurements obtained from passive sampling network
-
The data consists of temperature indices based on homogenized daily maximum and minimum temperatures at 338 locations across Canada, and of precipitation indices based on adjusted daily rainfall, daily snowfall and daily precipitation amounts at 463 locations across the country. These indices were selected for their relevance to social and economic impact assessment in Canada and for the insights they could provide regarding changes in extreme climate conditions. Please refer to the papers below for detailed information regarding the adjustment procedures and the trends in the indices.
-
This first version of the dataset (CanHoPmlyV1) contains homogenized time series of monthly total precipitation for 425 long-term stations in Canada. As detailed in Wang et al. (2023), it is based on the quality-controlled version 2020 of the Adjusted Daily Rainfall and Snowfall (AdjDlyRS) dataset (Wang et al. 2017; available at http://open.canada.ca/data/en/dataset/d8616c52-a812-44ad-8754-7bcc0d8de305), and on daily total precipitation data from automated gauges (including Belfort, Fisher & Porter, Nipher, Geonor, and Pluvio), with some records from neighbouring stations being joined to form long-term data series. Version 1 of ANUSPLIN surfaces of the adjusted monthly precipitation (MacDonald et al. 2021, available at https://open.canada.ca/data/en/dataset/779ea77a-0ad1-42f2-853e-833e1cbb9a13) was used to infill temporal data gaps in the 425 data series. A comprehensive semi-automatic data homogenization procedure was used to homogenize the data series. The aforementioned ANUSPLIN data and the Twentieth Century Reanalysis 20CRv3 ensemble-mean series of monthly precipitation (Slivinski et al., 2021) were used as reference in the homogeneity tests (Wang et al., 2023). The homogenized dataset provides more realistic trend estimates and shows better spatial consistency of trends than does the raw dataset (Wang et al. 2023). References: Wang, X.L, Y. Feng, V. Y. S. Cheng, H. Xu, 2023: Observed precipitation trends inferred from Canada’s homogenized monthly precipitation dataset, J. Clim., in press. DOI: 10.1175/JCLI-D-23-0193.1. Wang, X. L., H. Xu, B. Qian, Y. Feng, E. Mekis, 2017: The adjusted daily rainfall and snowfall data for Canada. Atmosphere-Ocean, 55:3, 155-168, DOI:10.1080/07055900.2017.1342163. MacDonald, H., D. W. McKenney, X. L. Wang, J. Pedlar, P. Papadopol, K. Lawrence, M. F. Hutchinson, 2021: Spatial Models of adjusted precipitation for Canada at varying time scales. J. Appl. Meteor. And Climatol., 60, 291-304. DOI: 10.1175/JAMC-D-20-0041.1. Slivinski, L. and coauthors, 2019: Towards a more reliable historical reanalysis: Improvements for version 3 of the Twentieth Century Reanalysis system. Q. J. R. Meteor. Soc., 2876-2908, https://doi.org/10.1002/qj.3598.
-
Anomalous weather resulting in Temperature and Precipitation extremes occurs almost every day somewhere in Canada. For the purpose of identifying and tabulating daily extremes of record for temperature, precipitation and snowfall, the Meteorological Service of Canada has threaded or put together data from closely related stations to compile a long time series of data for about 750 locations in Canada to monitor for record-breaking weather. Virtual Climate stations correspond with the city pages of weather.gc.ca. This data provides the daily extremes of record for Precipitation for each day of the year. Daily elements include: Greatest Precipitation.
-
The Regional Deterministic Precipitation Analysis (RDPA) produces a best estimate of precipitation amounts that occurred over a period of 24 hours. The estimate integrates data from in situ precipitation gauge measurements, weather radar, satellite imagery and numerical weather prediction models. Geographic coverage is North America (Canada, United States and Mexico). Data is available at a horizontal resolution of 10 km. The 24 hour analysis is produced twice a day and is valid at 06 and 12 UTC. A preliminary analysis is available approximately 1 hour after the end of the accumulation period and a final one is generated 7 hours later in order to assimilate more gauge data.
-
This dataset is part of the International Atomic Energy Agency (IAEA) Global Network of Isotopes in Precipitation (GNIP) project and contains the total monthly precipitation quantity in millimeters collected on the roof of the National Hydrology Research Centre in Saskatoon, SK and its stable oxygen (δ18O) and hydrogen (δ2H) isotope ratios data from June 1990 to January 2020. Up until 2013, a MSC copper rain gauge, modified to hold a HDPE bottle containing a thin layer of paraffin oil to prevent evaporation collected the summer precipitation. Summer precipitation collection from 2013 onward used a Palmex integrator. A plastic 20 L bucket emptied after each snow event collected the winter precipitation until 2015 when we switched to a MSC Nipher shielded snow gauge. To determine the quantity, the collected precipitation was weigh at the beginning of each month. The precipitation’s ratios of stable oxygen (δ18O) and hydrogen (δ2H) isotopes was determined using the IAEA GNIP manual. IAEA. Statistical treatment of data on environmental isotopes in precipitation. Vienna: International Atomic Energy Agency; 1992. (Technical Series Report; 331).