
Ice
Type of resources
Topics
Keywords
Contact for the resource
Provided by
Years
Formats
Representation types
Update frequencies
status
-
The Canadian Ice Service maintains a collection of Daily ice charts, Regional ice charts and Iceberg charts. These charts are available in GIF format and E00 (Regional Charts only).
-
This daily forecast describes the ice edge using latitude and longitude coordinates, the total ice concentration, the predominant ice stage of development and the concentration of the oldest ice type. Warnings are issued as appropriate. The forecasts are valid from the time of issue until the end of the following day (so for a period of 24 to 48 hours).
-
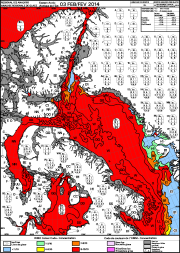
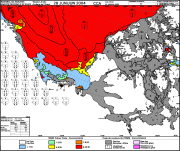
These ice charts illustrate ice conditions at a particular moment in time. The ice information is presented using a standard international code, known as the Egg Code. The following charts are available from the Canadian Ice Service: -Daily Ice Charts -Image Analysis Ice Charts -Regional Ice Charts
-
The EXCEL workbooks contained in this dataset primarily contain temporal variations of the water surface elevation (water level) at 12 locations situated along the lower Athabasca River during the 2013 spring ice breakup. This information was obtained using portable pressure (and occasionally temperature) loggers, inserted in robust casing designed to survive large water- and ice-induced forces. Such forces are generated by stationary or moving ice sheets and blocks as well as by sharp river waves that often accompany ice jam releases. Prolonged time periods of constant water level signify that the sensors were above water, recording atmospheric pressure and air temperature, where applicable. Detailed information regarding this dataset can be found in the following publication: Beltaos, S., Carter, T., Rowsell, R., and DePalma, S.G.S. 2018. Erosion potential of dynamic ice breakup in Lower Athabasca River. Part I: Field measurements and initial quantification. Cold Regions Science and Technology, Vol. 149: 16-28.
-
This river ice and river icing (aufeis) thickness, composition and hydrostatic water level data was collected over April 2 and 3, 2012 on the Muskeg, Ells and Firebag River in Alberta, Canada.
-
The Ice Thickness Program Collection contains ice thickness and snow depth measurements for 195 sites. Sites such as Eureka and Resolute have ice thickness records that go as far back as 1947. Record length varies from station to station with some of the Arctic stations exceeding 50 years of observations. Measurements are taken at approximately the same location every year on a weekly basis, starting after freeze-up when the ice is safe to walk on, and continuing until break-up or when the ice becomes unsafe. The location is selected close to shore, but over a depth of water which will exceed the maximum ice thickness.
-
Over the past five decades, many lakes, ponds, and wetlands (generically termed basins) of the Peace Sector of the Peace-Athabasca Delta (PAD), a significant component of the Wood Buffalo National Park (WBNP), have experienced drying trends in-between infrequent flooding generated by major spring ice jams that form in the lower Peace River. As a result of the 2017 UNESCO Monitoring Mission report, numerous remedial recommendations were made in the Wood Buffalo National Park (WBNP) Action Plan that has been prepared by Parks Canada in conjunction with various stakeholders, e.g. first nations, industry, provincial and territorial governments, federal departments. One of these recommendations is to develop a protocol for spring flow releases from the Peace Canyon Dam (or Site-C Dam in the future), which can enhance anticipated ice-jam flooding of the PAD. A key variable in such considerations is the river flow during the spring breakup of the ice cover. Using historical water Survey of Canada records of daily flow at a nearby hydrometric station (Peace River at Peace Point 59° 07' 05" N 112° 26' 13" W), peak daily and peak 7-day average flows have been determined for all years of the instrumental period that specifically apply to each year’s spring breakup event. These flows are provided in the attached excel file.
-
This daily forecast describes the ice edge using latitude and longitude coordinates, the total ice concentration, the predominant ice stage of development and the concentration of the oldest ice type. Warnings are issued as appropriate. The forecasts are valid from the time of issue until the end of the following day (so for a period of 24 to 48 hours).